Download presentation
Presentation is loading. Please wait.

1
Normality, P-values, Comparing 2 Groups Analysis of Biological Data Ryan McEwan and Julia Chapman Department of Biology University of Dayton ryan.mcewan@udayton.edu

2
First Principle: As a scientist, investigator or data handler, it is your personal responsibility to make sure that the analysis you are doing is appropriate. If you have a collaborator on the project who is a statistician, that is dandy, however, you should be able to explain the analysis, or else couch it in your own ignorance. If you do not have a statistician working directly with you, then you need to commit yourself to grinding out the proper analysis. Read some stats books! Look for analogous analyses in the literature, check out some on-line resources. This course, and any other course you can take, will only give you “doorways” or concepts for analysis that you can apply…it is up to you to verify, explore and excecute

3
Basic Challenge….how do you estimate the value from a population? Measures of Central Tendency Mean (arithmetic mean) Median (number in the middle) Mode (most often repeated) What about variation?
 Median (number in the middle) Mode (most often repeated) What about variation .")
4
Relationships among common central tendency measures

5
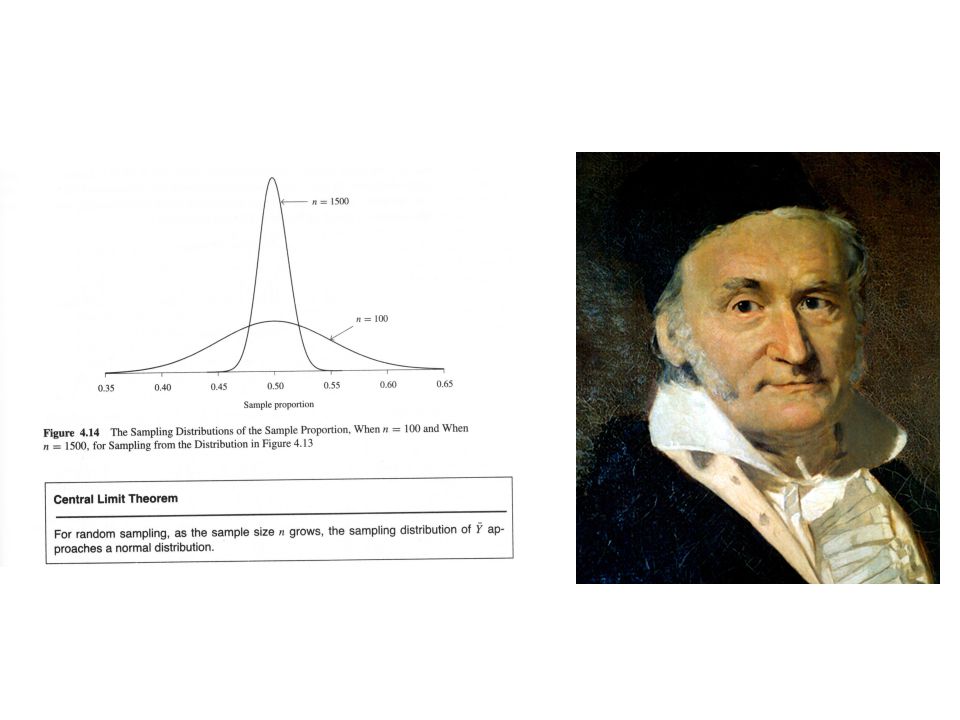
Johann Carl Friedrich Gauss (1777-1855) There is a bit of quibbling about whether this fellow, The Prince of Mathematics, indeed came up with the idea of a “normal distribution”…in any case “Gaussian” is often used interchangeably with “normal” in general statistical parlance.
 There is a bit of quibbling about whether this fellow, The Prince of Mathematics, indeed came up with the idea of a normal distribution …in any case Gaussian is often used interchangeably with normal in general statistical parlance.")
6
The Normal Distribution Holy Grail of probability distributions Often sought with enormous effort, rarely found

7
The Normal Distribution Various means and deviations

8
Johann Carl Friedrich Gauss (1777-1855) The main idea is about the probabilities of values that are arranged around the mean. Do the values take this shape….meaning is the variation symmetrical and rapidly dropping off?

11
Setting up a statistical hypothesis:

12
P-value: Is the probability that a difference of magnitude revealed in the analysis would occur if the values were NOT DIFFERENT. That is, the probability of a Type 1 Error, i.e., False Positive result.

14
How to do a t-test

Similar presentations


>")


768-2457 URL: URL: faculty.smu.edu/waynew.>")


