Download presentation
Presentation is loading. Please wait.

1
Interim Report of the West-Central New York Lineament Consortium Joseph P. Fagan, Jr. Centennial Geoscience, Inc. Dr. Robert Jacobi University at Buffalo

2
Acknowledgements This work was contracted for, and sponsored by, the New York State Energy Research and Development Authority (NYSERDA). Pennsylvania aeromagnetic data courtesy of AGI.

3
Objectives Describe the thinking behind the West- Central New York Lineament Consortium Review work to date and future plans Discuss how to participate

4
Background Present day topography reveals many clues about the subsurface geology. Work at SUNY has demonstrated the concept of fracture intensification domains, or FIDs. How do these FIDs compare with information on topographic maps?

6
Background Aeromagnetic data provide information about faulting patterns in the basement. As basement is brittle, lithologic contacts also can become the loci for fracturing. Reactivated basement faults can propagate fractures upwards through the sedimentary column.

8
Rock Fracture Group U 2 km SENECA LAKE TRANSECT NORTH VALOISHECTOR SOUTH 32 28 24 20 16 12 8 4 0 ENE EW Fractures/meter ENE EW Peaks/km Lineaments/ 1.32 km FRACTURES LINEAMENTS SOIL GAS 0 0.5 1.5 2.5 15 10 5 0 B

9
“Sandwiching” the fractures By combining the two methods—top down and bottom up—can we find areas of coincidental fracturing and/or faulting? If so, could these two sets be part of one continuous system that extends up from the basement and all the way to surface?

11
Study area Study area covers an area of western New York about 5,200 square miles 98 7-1/2’ quadrangles in study area Part of, or all of, thirteen counties within area

12
Map of study area

13
Data sets used in study High-resolution aeromagnetic data set flown by Geologic Survey of Canada in 1999 Newest version of digital elevation models (DEM) from USGS—data points every ten meters on orthogonal grid Earthsat 1997 study
 from USGS—data points every ten meters on orthogonal grid Earthsat 1997 study")
14
Outline of work DEM Compilation and Mapping Aeromagnetic/gravity processing Geophysical and Remote Sensing Integration Final integration and analysis

15
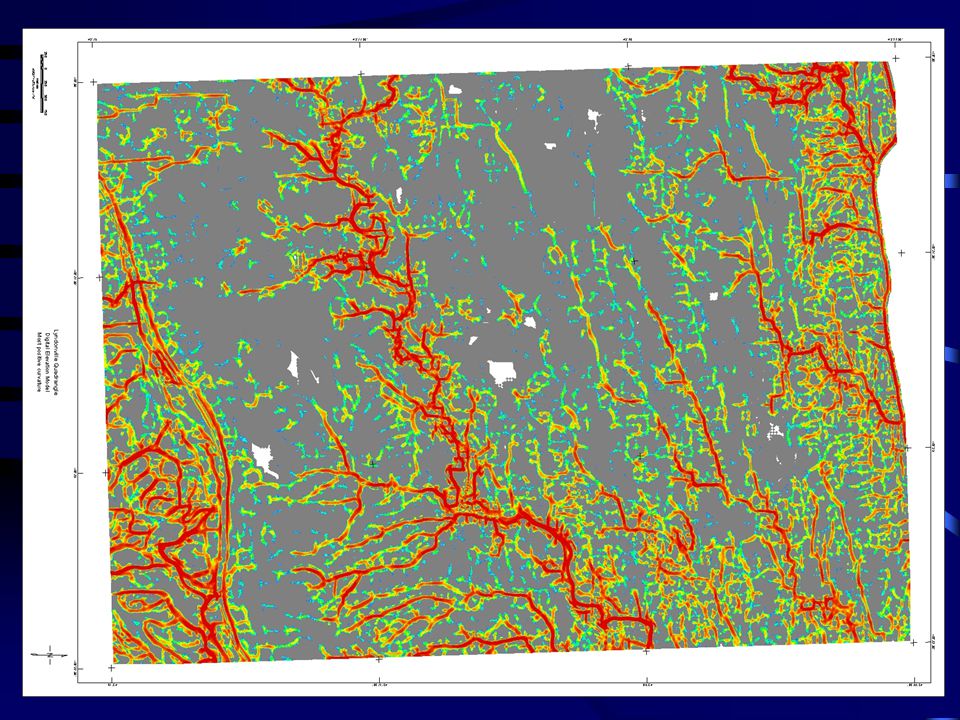
DEM Compilation 98 7-1/2’ quads were gridded and mapped. These grids were individually analyzed, and also merged into 15’ x 15’ quadrangles to permit easier analysis. Curvature analyses were run to identify possible FIDs.

16
Curvature? Curvature is a 2-D property that describes how bent a curve is at a particular point. Curvature depends on the scale that it is examined at. Areas of high curvature (topographically) occur on slope breaks such as hillsides and stream edges.
 occur on slope breaks such as hillsides and stream edges..")
20
Outline of work DEM Compilation and Mapping Aeromagnetic/gravity processing Geophysical and Remote Sensing Integration Final integration and analysis

21
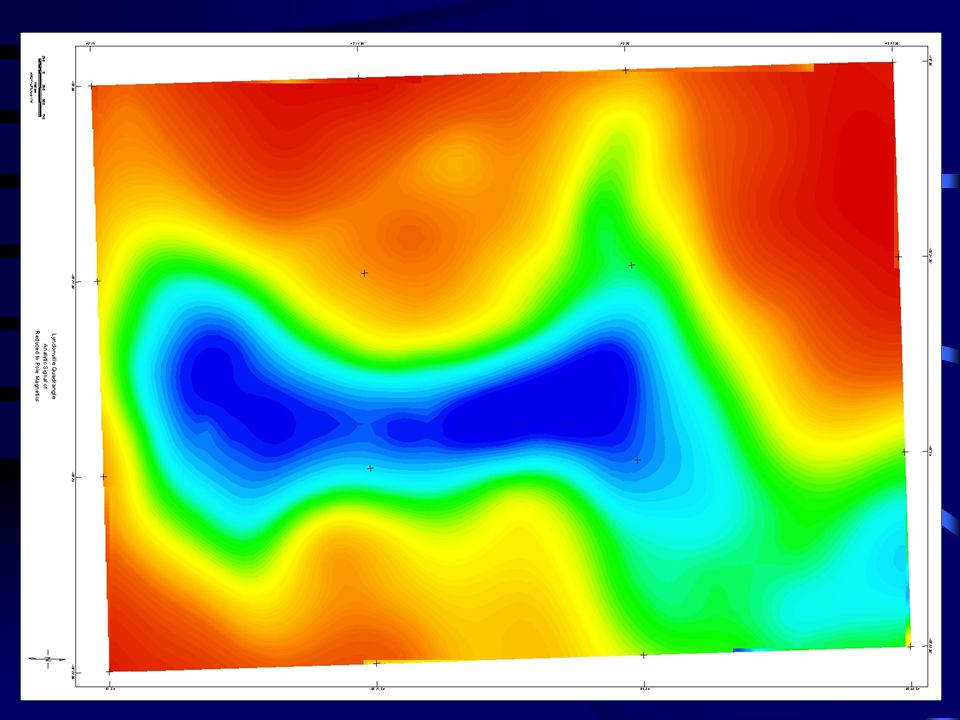
Aeromagnetic/gravity work Reprocess and interpret existing high- resolution aeromagnetic data Reprocess and interpret existing gravity data Integrate to complete structural interpretation

25
Outline of work DEM Compilation and Mapping Aeromagnetic/gravity processing Geophysical and Remote Sensing Integration Final integration and analysis

26
Geophysical / Remote Sensing Integration Merge DEM attributes with Earthsat’s Landsat lineaments. Compare these with structural interpretation from previous step to determine a subset of lineaments that may be related to basement structures.

27
Lineaments from EarthSat, 1997

29
Outline of work DEM Compilation and Mapping Aeromagnetic/gravity processing Geophysical and Remote Sensing Integration Final integration and analysis

30
Final Analysis Determine which major lineaments are most likely to be related to basement faulting. Create integrated map showing areas of faulting/fracturing at both basement and surface levels.

31
Participating in the consortium Anyone may participate—private industry, government organization, or university. Consortium members will receive: DEM data and derivatives, aeromagnetic data w/ interpretation, gravity data, integrated maps showing areas of faulting/fracturing at both basement and surface levels, and summary reports.

32
Participating in the consortium Purchase price to participate: $5,000 for the entire area. Anticipated completion date: Spring, 2005.

Similar presentations


Bent Creek Research.>")


