Download presentation
Presentation is loading. Please wait.

1
What is wave front

4
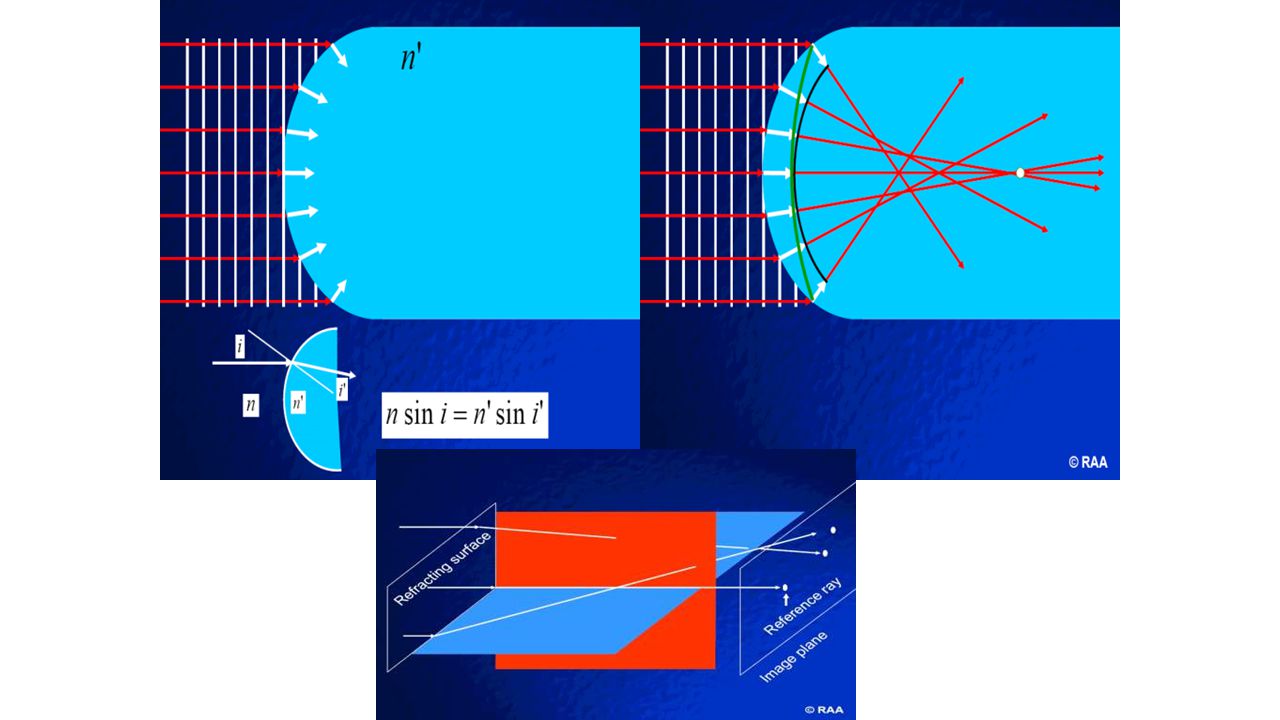
The Cartesian ellipsoid produces a stigmatic image of only one object point Normal eye and most of optical systems are not free from aberration. Hard to manufacture

5
Reference sphere: a circular arc centered on the image point with a radius equal to the image distance

6
Wave front aberration: the difference between the reference sphere and the wave front
The time each runner finishes minus the time of the fastest runner

7
Optical aberrations Approximately 80% - 90% of visual aberration error can be explained through the low order (first and second order) aberrations: 1st Order Aberation =Tilt (prism) 2nd Order Aberation = Defocus (sphere) and cylinder The less frequent high order aberrations represent the residual 10% to 20%: (mostly induced surgically) 3rd Order Aberation = Coma and trefoil 4th Order Aberation = Spherical and quadrafoil 5th Order Aberation = Distortions / irregular astigmatism 6th to 8th Order Aberation = Significantly increasing levels of irregular astigmatism, Diffraction Chromatic aberrations
 aberrations: 1st Order Aberation =Tilt (prism) 2nd Order Aberation = Defocus (sphere) and cylinder. The less frequent high order aberrations represent the residual 10% to 20%: (mostly induced surgically) 3rd Order Aberation = Coma and trefoil 4th Order Aberation = Spherical and quadrafoil 5th Order Aberation = Distortions / irregular astigmatism 6th to 8th Order Aberation = Significantly increasing levels of irregular astigmatism, Diffraction. Chromatic aberrations.")
8
Refractive errors of the eye can be described in terms of the shape of a wavefront of light that has passed through the eye's optics. With aberration-free optics, wavefronts exiting the eye are perfectly flat (top). Refractive errors, such as myopia, distort the wavefront (bottom). Other refractive errors, including higher-order aberrations, cause wavefront distortions that differ in shape from those seen in simple myopia
. Refractive errors, such as myopia, distort the wavefront (bottom). Other refractive errors, including higher-order aberrations, cause wavefront distortions that differ in shape from those seen in simple myopia.")
9
The difference between the wave front and the reference sphere is the Wave front aberration

10
What are aberrometers? Instruments that measure refractive errors
(super auto-refractors) Sphere, cylinder + HOAs(Higher-order aberrations) ≠ corneal topography! . One caution I'll mention here is to not confuse aberrometry with corneal topography. COAS
 Sphere, cylinder + HOAs(Higher-order aberrations) ≠ corneal topography! . One caution I ll mention here is to not confuse aberrometry with corneal topography. COAS.")
11
Measurement of optical aberrations Wave front analyzer systems
.Hartman-shack aberrometry (outgoing aberronetry), a low intensity laser beam is directed onto the retina, a lens array focuses the outcoming light rays onto a photoreceptor (CCD) .Tscherning aberrometry (ingoing aberrometry), a collimated beam is passed through a mask of holes and into the eye, a high magnification camera captures the image onto the retina .Retina ray tracing technique (ingoing aberrometry), a laser beam is used to scan across the pupil in a sequential manner, each position focus a single point on fovea
, a low intensity laser beam is directed onto the retina, a lens array focuses the outcoming light rays onto a photoreceptor (CCD) .Tscherning aberrometry (ingoing aberrometry), a collimated beam is passed through a mask of holes and into the eye, a high magnification camera captures the image onto the retina. .Retina ray tracing technique (ingoing aberrometry), a laser beam is used to scan across the pupil in a sequential manner, each position focus a single point on fovea.")
12
History of HO aberrometry
Reagan 1970s and 80s, Strategic defense Refraction through the atmosphere Astronomy Adaptive optics (AO) Shack-Hartman wavefront sensor Shack There’s some interesting history behind the development of modern ophthalmic aberrometers. In the 1970s and 80s the Defense Department was working hard to develop atmospheric aberrometers for strategic missile defense as a part of President Reagan’s Strategic Defense Initiative. The problem is that fluctuating refraction through the turbulent atmosphere made it difficult to track and shoot down incoming ballistic missiles. As a part of this effort, Dr. Roland Shack of the University of Arizona, developed what has become the most popular method for measuring higher-order aberrations, the Shack-Hartmann wavefront sensor. In the 1980s and 90s astronomers began fitting the world’s largest telescopes with Shack-Hartmann sensors to measure, and deformable mirrors to correct, atmospheric aberrations and thereby improve telescope images. This lead to the field known as adaptive optics or AO.
 Shack-Hartman wavefront sensor. Shack. There’s some interesting history behind the development of modern ophthalmic aberrometers. In the 1970s and 80s the Defense Department was working hard to develop atmospheric aberrometers for strategic missile defense as a part of President Reagan’s Strategic Defense Initiative. The problem is that fluctuating refraction through the turbulent atmosphere made it difficult to track and shoot down incoming ballistic missiles. As a part of this effort, Dr. Roland Shack of the University of Arizona, developed what has become the most popular method for measuring higher-order aberrations, the Shack-Hartmann wavefront sensor. In the 1980s and 90s astronomers began fitting the world’s largest telescopes with Shack-Hartmann sensors to measure, and deformable mirrors to correct, atmospheric aberrations and thereby improve telescope images. This lead to the field known as adaptive optics or AO.")
13
Zernike analysis & Zernike coefficients
Breaks the wave front down into the Standard Zernike modes or Magnitude & axis form Each Zernike mode = one aberration Z analysis also provides a value for each Zernike mode: Units in microns,±sign Absolute Zernike coefficient = magnitude Must specify pupil size To recap, … [read]

14
RMS wave front error Total aberrations (LOAs + HOAs)
higher-orders (HOA RMS) just third-order aberrations, etc. The basic data = individual Zernike coefficients When we do aberrometry, we want to know how bad the aberrations are. We’ve seen that the standard aberrometer printout will tell us how bad each individual aberration is. But sometimes we want to know how bad combined aberrations are. For example, how bad are the total aberrations of an eye? That was RSM wavefront error is for. The RMS wavefront error describes the magnitude of combined aberrations for any combination. If you know the Zernike coefficients, you can easily compute the RMS wavefront error by the formula shown here. You just take each Zernike coefficient, square it, sum them, then take the square root. You can do this for any combination of aberrations. The total RMS tells you how bad the aberrations are for all aberrations (higher and lower orders) combined. You can also calculate total HO RMS, which tells you the magnitude of just the higher order aberrations combined. You could also calculate RMS for just the third, or just the fourth order aberrations, etc.
 just third-order aberrations, etc. The basic data = individual Zernike coefficients. When we do aberrometry, we want to know how bad the aberrations are. We’ve seen that the standard aberrometer printout will tell us how bad each individual aberration is. But sometimes we want to know how bad combined aberrations are. For example, how bad are the total aberrations of an eye That was RSM wavefront error is for. The RMS wavefront error describes the magnitude of combined aberrations for any combination. If you know the Zernike coefficients, you can easily compute the RMS wavefront error by the formula shown here. You just take each Zernike coefficient, square it, sum them, then take the square root. You can do this for any combination of aberrations. The total RMS tells you how bad the aberrations are for all aberrations (higher and lower orders) combined. You can also calculate total HO RMS, which tells you the magnitude of just the higher order aberrations combined. You could also calculate RMS for just the third, or just the fourth order aberrations, etc.")
15
J Cataract Refract Surg. 2006 Dec;32(12):2064-74.
Normal-eye Zernike coefficients and root-mean-square wavefront errors. Salmon TO, van de Pol C. METHODS: Data were collected from 10 laboratories that measured higher-order aberrations (HOAs) in normal, healthy adult eyes using Shack-Hartmann aberrometry (2560 eyes of 1433 subjects). Signed Zernike coefficients were scaled to pupil diameters of 6.0 mm, 5.0 mm, 4.0 mm, and 3.0 mm and corrected to a common wavelength of 550 nm. The mean signed and absolute Zernike coefficients across data sets were compared. Then, the following were computed: overall mean values for signed and absolute Zernike coefficients; polar Zernike magnitudes and RMS values for coma-like aberrations (Z(3)(+/-1) and Z(5)(+/-1) combined); spherical-like aberrations (Z(4)(0) and Z(6)(0) combined); and 3rd-, 4th-, 5th-, and 6th-order, and higher-order aberrations (orders 3 to 6). RESULTS: The different data sets showed good agreement for Zernike coefficients values across most higher-order modes, with greater variability for Z(4)(0) and Z(3)(-1). The most prominent modes and their mean absolute values (6.0-mm pupil) were, respectively, Z(3)(-1) and 0.14 microm, Z(4)(0) and 0.13 microm, and Z(3)(-3) and 0.11 microm. The mean total higher-order RMS was 0.33 microm. CONCLUSIONS: There was a general consensus for the magnitude of HOAs expected in normal adult human eyes. At least 90% of the sample had aberrations less than double the mean values reported here. These values can serve as a set of reference norms.
 in normal, healthy adult eyes using Shack-Hartmann aberrometry (2560 eyes of 1433 subjects). Signed Zernike coefficients were scaled to pupil diameters of 6.0 mm, 5.0 mm, 4.0 mm, and 3.0 mm and corrected to a common wavelength of 550 nm. The mean signed and absolute Zernike coefficients across data sets were compared. Then, the following were computed: overall mean values for signed and absolute Zernike coefficients; polar Zernike magnitudes and RMS values for coma-like aberrations (Z(3)(+/-1) and Z(5)(+/-1) combined); spherical-like aberrations (Z(4)(0) and Z(6)(0) combined); and 3rd-, 4th-, 5th-, and 6th-order, and higher-order aberrations (orders 3 to 6). RESULTS: The different data sets showed good agreement for Zernike coefficients values across most higher-order modes, with greater variability for Z(4)(0) and Z(3)(-1). The most prominent modes and their mean absolute values (6.0-mm pupil) were, respectively, Z(3)(-1) and 0.14 microm, Z(4)(0) and 0.13 microm, and Z(3)(-3) and 0.11 microm. The mean total higher-order RMS was 0.33 microm. CONCLUSIONS: There was a general consensus for the magnitude of HOAs expected in normal adult human eyes. At least 90% of the sample had aberrations less than double the mean values reported here. These values can serve as a set of reference norms.")
16
HOA results Prominent individual HOAs (6.0-mm pupil)
Pupil diameter Mean (µm) 2x mean 6.0 0.33 0.66 5.0 0.19 0.38 4.0 0.10 0.20 Prominent individual HOAs (6.0-mm pupil) Z3-1 (vertical coma) = 0.14 Z40 (spherical aberration) = 0.13 Z3-3 (oblique trefoil) = 0.11 Here’s a few of the main results from that study. The table shows the mean HO RMS values that we found for 3 pupil sizes. A good number to keep in mind is the value for a 6.0- mm pupil. The mean HO RMS was 0.33 µm. In the right column I list a value that is double the means. I found that 90% of these presumably normal eyes had RMS values less than double the means, so suggest this as a simple cut-off criteria to diagnose abnormally high aberrations. The most prominent individual aberrations, averaged across all eyes were the three listed here: vertical coma, spherical aberrations and oblique trefoil. For more specific details, please refer to the tables in the article, which are available on my web page.
 2x mean Prominent individual HOAs (6.0-mm pupil) Z3-1 (vertical coma) = Z40 (spherical aberration) = Z3-3 (oblique trefoil) = Here’s a few of the main results from that study. The table shows the mean HO RMS values that we found for 3 pupil sizes. A good number to keep in mind is the value for a 6.0- mm pupil. The mean HO RMS was 0.33 µm. In the right column I list a value that is double the means. I found that 90% of these presumably normal eyes had RMS values less than double the means, so suggest this as a simple cut-off criteria to diagnose abnormally high aberrations. The most prominent individual aberrations, averaged across all eyes were the three listed here: vertical coma, spherical aberrations and oblique trefoil. For more specific details, please refer to the tables in the article, which are available on my web page.")
17
Magnitude & axis form piston 1 prism 2 sphere astigmatism coma trefoil
Z0 1 prism Z11 2 sphere astigmatism Z20 Z22 coma trefoil 3 When you combine the similar modes, it reduces the number of Zernike modes, and for some doctors this is a more intuitive way to break down the aberrations. For example, in the second order, instead of describing astigmatism in terms of two Zernike modes, Z(2,-2) and Z(2,2), each with some Zernike coefficient (two numbers for astigmatism), you can describe it as a single mode, Z22 (shown here). But in this case the Z22 could vary, not only in its value (magnitude), but also in its orientation. So we’d have to specify this particular mode In terms of both its magnitude and axis. This, in fact, is how we normally describe astigmatism in clinical optometry, with some power (in diopters) and an axis, to indicate orientation. Likewise with coma or trefoil, when combined into single modes as shown here, you need to specify both its magnitude and axis. I refer to the modes combined in this way as the polar Zernike modes. ANSI calls them the magnitude/axis Zernike polynomials. Some aberrometers present their results using the standard Zernike modes, while others use the polar Zernike modes. You should understand both. You might wonder why we bother with the standard Zernike polynomials if the magnitude/axis expression is more intuitive. For certain wavefront calculations, you must use the standard form. For example, when adding or subtracting optical aberrations for separate elements in an optical system, like the cornea and lens, you must use the standard Zernike set. You can’t add the polar magnitudes directly. So vision scientist tend to use the standard form, but clinicians may prefer to polar form. Z31 Z33 spherical aberration 4 quadrafoil Z40 Z42 Z44 order (n) secondary astigmatism
 and Z(2,2), each with some Zernike coefficient (two numbers for astigmatism), you can describe it as a single mode, Z22 (shown here). But in this case the Z22 could vary, not only in its value (magnitude), but also in its orientation. So we’d have to specify this particular mode In terms of both its magnitude and axis. This, in fact, is how we normally describe astigmatism in clinical optometry, with some power (in diopters) and an axis, to indicate orientation. Likewise with coma or trefoil, when combined into single modes as shown here, you need to specify both its magnitude and axis. I refer to the modes combined in this way as the polar Zernike modes. ANSI calls them the magnitude/axis Zernike polynomials. Some aberrometers present their results using the standard Zernike modes, while others use the polar Zernike modes. You should understand both. You might wonder why we bother with the standard Zernike polynomials if the magnitude/axis expression is more intuitive. For certain wavefront calculations, you must use the standard form. For example, when adding or subtracting optical aberrations for separate elements in an optical system, like the cornea and lens, you must use the standard Zernike set. You can’t add the polar magnitudes directly. So vision scientist tend to use the standard form, but clinicians may prefer to polar form. Z31. Z33. spherical. aberration. 4. quadrafoil. Z40. Z42. Z44. order (n) secondary astigmatism.")
18
1 2 3 order (n) Z11 Z22 Z31 Z33 Z1-1 Z11 Combined Zernike modes Z2-2
Within each Zernike order (except 0th order), or row, are some modes that have the same shape, but are just rotated with respect to each other. The can be combined, as shown. Z3-3 Z33 Z31 3 Z3-1 Z31 order (n) Z33
, or row, are some modes that have the same shape, but are just rotated with respect to each other. The can be combined, as shown. Z3-3. Z33. Z Z3-1. Z31. order (n) Z33.")
19
Conventional Rx: Zernike coefficients +0.25 -0.75 x 111 values
2nd order 3rd order 4th order Mode: Z2-2 Z20 Z22 Z3-3 Z3-1 Z31 Z33 Z4-4 Z4-2 Z40 Z42 Z44 Coefficient (µm): Unit = µm + or - values Rx: x 111 Pupil diameter: 5.6 mm Total RMS: µm Higher-order RMS: µm Here’s the wavefont we saw before and a list of the aberrations contained in the wavefront. The conventional sphero-cyl Rx for this eye is x 111. Below it is the Zernike Rx for the same eye. It lists 12 Zernike modes, with a numerical coefficient that tell you how much of each mode is present. The unit for Zernike coefficients are micrometers (microns). Below is additional important information that you will see in an aberrometer printout: pupil size, total RMS and higher-order RMS. Whenever you specify a Zernike Rx, you must include the pupil size. The Zernike coefficients are specific for one pupil size. If you change the pupil size, the coefficients will change. Also, note the RMS values. This is a commonly used way to describe the magnitude of an eye’s aberrations. I’ll explain this next.
: Unit = µm. + or - values. Rx: x 111. Pupil diameter: 5.6 mm. Total RMS: 0.76 µm. Higher-order RMS: 0.51 µm. Here’s the wavefont we saw before and a list of the aberrations contained in the wavefront. The conventional sphero-cyl Rx for this eye is x 111. Below it is the Zernike Rx for the same eye. It lists 12 Zernike modes, with a numerical coefficient that tell you how much of each mode is present. The unit for Zernike coefficients are micrometers (microns). Below is additional important information that you will see in an aberrometer printout: pupil size, total RMS and higher-order RMS. Whenever you specify a Zernike Rx, you must include the pupil size. The Zernike coefficients are specific for one pupil size. If you change the pupil size, the coefficients will change. Also, note the RMS values. This is a commonly used way to describe the magnitude of an eye’s aberrations. I’ll explain this next.")
20
HO RMS & pupil size This shows how her HO RMS for OD and OS compared to normal average values for different pupil sizes. The red and blue lines respectively show the values for OD and OS. The lower black line shows the mean values for normal eyes. Can we do anything for these patients? Enhancement surgery was not an option because she already had too many incisions and scarring. An RGP lens might help, but it would probably be difficult to fit. Another option is to prescribe a miotic drop such as Alphagan, to reduce pupil size. This graph shows how much you can reduce the HO RMS wavefront error by decreasing pupil size. If you can reduce pupil size from 5.0 mm to 3.0 mm, you can reduce the HO RMS by about 75%! This is what I decided to do and it worked. She says Alphagan has improved her vision and she no longer has the eye strain and HAs. (Retina illumination will decrease to about 1/3 or a 64% decrease.) This once again shows the importance of pupil size, when it come to diagnosing and managing ocular aberrations.
 This once again shows the importance of pupil size, when it come to diagnosing and managing ocular aberrations.")
21
Tscherning aberroscope
Tscherning aberroscope. Modern techniques use a projected grid of dots (left) and images the resultant pattern distortion on the retina (right) to determine aberrations.
 and images the resultant pattern distortion on the retina (right) to determine aberrations.")
22
The MTF: measures the contrast loss with increasing spatial frequency when transferring an object to animage through an aberrated optical system. Spatial frequency is defined by the number of cycles (line pairs) per distance. It is known that fine details (high spatial frequencies) are the first to be affected when the quality of an optical system is degraded. As a functionof the diffraction and the importance of optical aberrationsof the system studied, it is possible todetermine the fashion in which the optical system reducesthe contrast between specific spatial frequenciesand to deduce the optical quality of the image that isrendered.
 per distance. It is known that fine details. (high spatial frequencies) are the first to be affected. when the quality of an optical system is degraded. As a functionof the diffraction and the importance of optical aberrationsof the system studied, it is possible todetermine the fashion in which the optical system reducesthe contrast between specific spatial frequenciesand to deduce the optical quality of the image that isrendered.")
23
One disadvantage of Zernike is that in highly aberratedeyes, such as in keratoconus, the Zernike decompositioninvolves the creation of numerous basisf unctions that require complex calculations to representt accurately. The Fourier polynomial system was later suggested as an alternative to decompose the wavefront map based on the claim that given a limitedset of basis functions, the Fourier expansionwould be more efficient and more reliable in reproducingthe overall wavefront map

24
FMOS is a powerful wide-field spectroscopy system that enables near-infrared spectroscopy of over 100 objects at a time. It is composed of three subsystems: 1) an infrared unit at prime focus (PIR) that includes a wide-field corrector lens system and fiber positioning system ("Echidna"), 2) a fiber bundle unit of 400 optical fibers, and 3) two spectrographs. Echidna can precisely position all 400 fibers in just 15 minutes. This high speed for repositioning allows observers to reconfigure Echidna, observe multiple fields during a night and rapidly observe hundreds of faint targets that can be compiled as data for statistical analysis... Fiber Multi-Object Spectrograph (FMOS)
")
25
An exciting new promising application is the combination
of wavefront with other technologies such as topography, biometry, Scheimpflug, and/or optical coherence tomography, and this is likely to refine the modeling of the eye for ideal refractive correction. Other areas related to wavefront technology, such as enhancing the precision and reproducibility of wavefront simulations with the adaptive optics visual stimulator and a better delivery system of the desired wavefront pattern to the cornea with enhanced laser technology, can be further developed. In this way, the initial quest for super vision with customized laser vision correction might someday be delivered, with the possibility of achieving better results than the initial CDVA.

26
Clinical HO aberrometry
Laser refractive surgery Large HOAs Clinical aberrometry Wavefront-guided LASIK Meanwhile, in the late 1990s laser refractive surgery was becoming popular. This was very significant for clinical aberrometry, since it was creating a population of patients who now had large higher- order aberrations. This created a clinical need to measure and correct those aberrations, and this prompted the development of clinical aberrometers, and new methods to correct these complex refractive errors. COAS

27
Summary 2 Q. What are aberrometers?
A. Instruments that measure refractive errors, including HOAs. Let’s begin with the first point. What are aberrations? That’s easy! Aberrations are just refractive errors. All of you are familiar with myopia, hyperopia and astigmatism, but many people don’t realize that there are other refractive errors besides these. Myopia, hyperopia, and astigmatism are refractive errors that can be referred to as lower-order aberrations. Another lower-order aberration that you don’t hear much about is prism. Optometrists have been routinely correcting lower-order aberrations for over a century. For most normal eyes, the main refractive errors are just these familiar lower-order aberrations. But it’s possible to have other, in fact, many other kinds of refractive errors. The other refractive errors besides prism, sphere and astigmatism are called the higher-order aberrations. You’ve probably heard of some of these higher-order refractive errors. The most familiar ones are coma, spherical aberration and trefoil. There are many others.

28
3. How do they work? Light is projected in. Reflect off the retina
Light passes through the eye’s optics. Catch the light. Analyze it. Reconstruct the optical wavefront’s shape What, exactly, do aberrometers measure? Like auto-refractors, Shack-Hartmann aberrometers project light into the eye, reflect it off the retina, and analyze the light emitted from the eye. What they specifically measure is the shape of an optical wavefront that has passed through the eye’s optical elements. In this figure the optical wavefronts passing through the eye are represented by the red arcs and red lines. These represent optical wavefronts, seen in cross-section, emitted from a focal point on the retina, and traveling out of the eye. If the eye were perfectly aberration-free, the wavefronts exiting the eye would be perfectly flat, as represented by the red lines in front of the eye. Any refractive errors present in the eye would cause distortions in the wavefront’s shape. If we can analyze the wavefront’s shape, then we can determine which refractive errors, that is, aberrations, were present in the eye.

29
Summary 4. Interpreting the data
Aberrometers measure wavefronts Wavefront - distorted by aberrations Zernike analysis - which aberrations are present Zernike coefficients - how bad they are Data in microns, with ± signs RMS - magnitude of grouped aberrations Pupil size, pupil size, pupil size ! This completes Learning Objective #3. Refractive errors (aberrations) distort the light passing through the eye, so we can measure aberrations by measuring the shape of a wavefront that has passed through the eye’s optics. We can visualize the shape of the wavefront using a topographic map. Each particular aberration causes a particular kind of wavefront distortion. Zernike polynomials allows us to determine, which and how much of the various aberrations contributed to that wavefront. Zernike coefficients are given in units of microns, and you should always specify pupil size when you list Zernike coefficients. The RMS value is useful, since it is a single number that summarizes how large the total aberrations are. The HO RMS tells us how large the HOAs are when they are summed together. Once again, you must specify pupil size.
 distort the light passing through the eye, so we can measure aberrations by measuring the shape of a wavefront that has passed through the eye’s optics. We can visualize the shape of the wavefront using a topographic map. Each particular aberration causes a particular kind of wavefront distortion. Zernike polynomials allows us to determine, which and how much of the various aberrations contributed to that wavefront. Zernike coefficients are given in units of microns, and you should always specify pupil size when you list Zernike coefficients. The RMS value is useful, since it is a single number that summarizes how large the total aberrations are. The HO RMS tells us how large the HOAs are when they are summed together. Once again, you must specify pupil size.")
30
5. Diagnosis - what’s normal?
Aberrometry - diagnoses abnormal optics Ideal eye = zero aberrations, but … every eye has some aberrations. So, are those Zernike or RMS values good or bad? Need reference norms Aberrometry provides valuable diagnostic information about the eye’s refractive errors. Usually we use aberrometry to tell if a certain eye, or certain optical correction is good or bad. Of course, it would be great if each eye had had zero aberrations. The problem is that aberrometry is so precise that it can measure can measure even very subtle aberrations, and you’ll never find an eye that is perfectly aberration-free. So any aberrometer measurement will provide you with a list of Zernike coefficients describing that eye’s aberrations. The question is, are these values good or bad? Or, if they’re bad, how bad are they? In order to differentially diagnose aberrometer results, you need to have a set of norms for comparison.

31
OCO Norms JCRS Dec 2006 2,560 normal eyes 9 sites Zernike & RMS norms
Data on www Google “Dr. Salmon” In order to provide the eye care and scientific community with reference norms, I did a study of Shack-Hartmann measurments of 2,560 normal eye and published tables of normal-eye values last December in the Journal of Cataract and Refractive surgery. You can download the article and summary tables from my web site. I’ll summarize a few of the main findings in the next slide.

32
Downloadable info Full article in PDF Norms table - PDF & Excel
Signed Zernike coefficients Absolute values Combined (polar) Zernike modes RMS for HOA and orders 3, 4, 5, 6 Several wavefront technology references are available for free downloading from my web page. You’ll find them in the left column of my home page. This includes a PDF file of the article in Cataract and Refractive Surgery describing our analysis of normal-eye aberrations, as well as summary tables in PDF and Excel format. The norms show mean values for standard signed Zernike coefficients, absolute values for standard Zernike coefficients, polar Zernike coefficients and RMS values for total HOAs and for orders 3, 4, 5, 6. My web address is shown.
 Zernike modes. RMS for HOA and orders 3, 4, 5, 6. Several wavefront technology references are available for free downloading from my web page. You’ll find them in the left column of my home page. This includes a PDF file of the article in Cataract and Refractive Surgery describing our analysis of normal-eye aberrations, as well as summary tables in PDF and Excel format. The norms show mean values for standard signed Zernike coefficients, absolute values for standard Zernike coefficients, polar Zernike coefficients and RMS values for total HOAs and for orders 3, 4, 5, 6. My web address is shown.")
33
ضمن عرض پوزش بدلیل حجم بالای LECTUER ادامه اسلایدها امکان پذیر نمیباشد در صورت نیاز به ادامه لطفا به واحد سمعی و بصری مرکز آموزشی درمانی فیض مراجعه و یا با شماره تلفن داخلی 392 تماس حاصل نمائید با تشکر

Similar presentations


 1)Noninvasive 2) non-contact imaging 3)Millimeter penetration Aproximately 2-3 mm in tissue with micrometer scale (axial.>")


 straight lines: the pinhole camera’s inverted image Enlarging the pinhole leads.>")


 Endolenticular.>")
