Download presentation
Presentation is loading. Please wait.

1
Desistance and Legitimacy: Effect Heterogeneity in a Field Experiment on High Risk Groups Jeffrey Fagan Andrew Papachristos Danielle Wallace Tracey Meares American Society of Criminology St. Louis November 2008

2
Background PSN as demand-side intervention designed to reduce gun carrying and gun use Recent policy preferences lean toward specific deterrence and forced compliance: intensive cost- based strategies of close surveillance coupled with low threshold interventions to incapacitate offenders. – Risk increase by changing police surveillance strategies to focus on weapons and intensifying parole and probation supervision – Cost increase by threat of federalizing gun crimes Longer sentences, higher conviction rates with tougher plea negotiations

3
PSN combines applies alternate strategy to engage offenders in more complex rational choice calculus where elevated risks and costs of offending are offset by simultaneous increases in the benefits of compliance and crime avoidance. – Federal prosecution for gun crimes – Longer sentences – Gun-focused policing and seizures – Serious offers of social, economic and other human services in group dynamic (forums) Providing capital to high risk groups in resource-starved neighborhoods is designed to legitimate legal sanctions in context-neutral forums that clarify and promote more balanced deterrence signals Designed for and implemented in two Chicago neighborhoods with very high homicide and gun crime rates.
 Providing capital to high risk groups in resource-starved neighborhoods is designed to legitimate legal sanctions in context-neutral forums that clarify and promote more balanced deterrence signals Designed for and implemented in two Chicago neighborhoods with very high homicide and gun crime rates..")
5
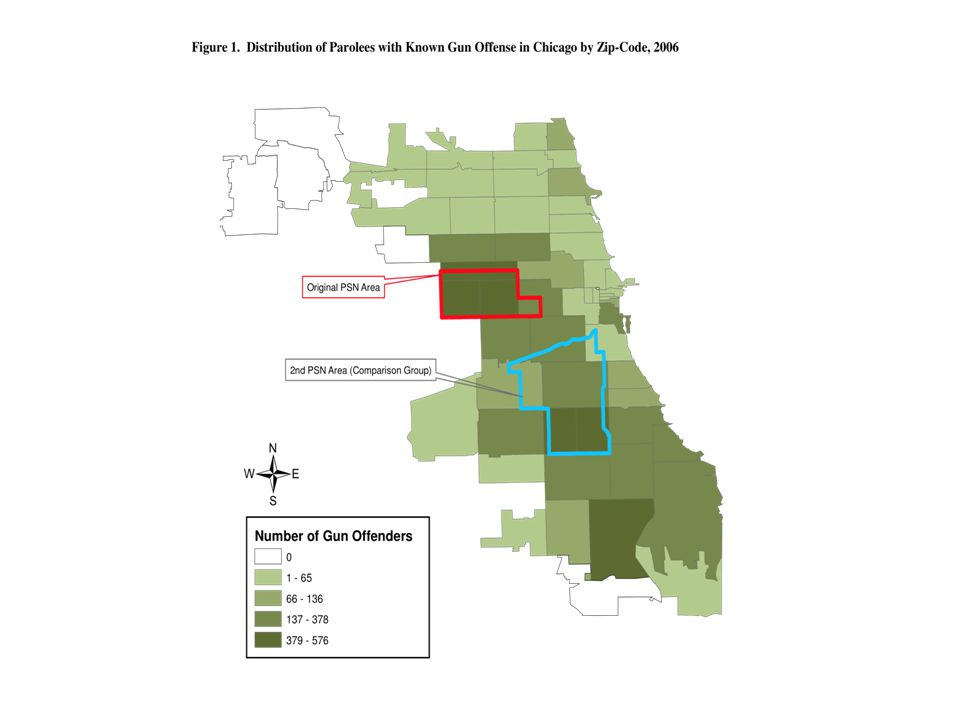
Assignment Groups Moran’s I =.378, p =.001 Control Beats PSN Beats Guns and Homicides are not randomly distributed Treatment – 24 beats on West Side Control: – 30 beats on South side

6
Research Design Quasi-Experimental Panel Design – Near -equivalent Control Group – Panel data of every “neighborhood” in Chicago from 1999 to 2006 – Multi-level modeling strategy to assess within and between group variation in neighborhoods – Neighborhood and individual data Data – Multiple sources – CPD, ATF, IDOC, and the Census – Crime reports geocoded to police beat – Quarterly from January 1999 to December 2006 – Individual data reported by zip code (!@#*)

7
Neighborhood Results Strong declines in homicides in target areas compared to control areas and citywide rates No evidence of displacement to adjacent police districts – We use propensity scores to adjust for differences in target and control areas as well as secular trends in the city – Declines evident in both homicide and other gun crimes Compared to other PSN components, the number and saturation of PSN forums exerts the strongest influence on recidivism rates Aggregate effects on social networks of gun offenders? Aggregation produces generalized effects (general deterrence) via social influence model?
 via social influence model .")
8
Figure 4. Fitted Model Summary with 95 % CI

9
Results 1. Summary of PSN Neighborhood Effects PSN Predictor Homicides (logged) Gun Homicides (logged) Gang Homicides (logged) Aggravated Battery (logged) PSN (Dummy) Coeff -0.052-0.053-0.011-0.012 Exp(B) 0.9490.9480.9890.988 SE 0.013 0.008 p-value 0.000 0.2350.159 Percent Offenders Attend Forum Coeff -1.17-0.782-0.951-0.063 Exp(B) 0.3100.4570.3860.939 SE 0.5280.4310.2850.193 p-value 0.0260.0720.0010.744
 Gun Homicides (logged) Gang Homicides (logged) Aggravated Battery (logged) PSN (Dummy) Coeff Exp(B) SE p-value Percent Offenders Attend Forum Coeff Exp(B) SE p-value")
10
Results 2. Summary of PSN Neighborhood Effects PSN Predictor Homicides (logged) Gun Homicides (logged) Gang Homicides (logged) Aggravated Battery (logged) ATF Seizures Coeff -0.002 -0.000090.003 Exp(B) 0.998 1.0001.003 SE 0.001 0.00070.003 p-value 0.0750.0420.8940.325 Prosecutions (logged) Coeff -0.031-0.024-0.0170.007 Exp(B) 0.9690.9760.9831.007 SE 0.017 0.0110.007 p-value 0.0750.1500.1280.368 Person-Month Sentences (logged) Coeff -0.003 0.002-0.02 Exp(B) 0.997 1.0020.980 SE 0.005 0.0030.002 p-value 0.6580.9430.4900.298
 Gun Homicides (logged) Gang Homicides (logged) Aggravated Battery (logged) ATF Seizures Coeff Exp(B) SE p-value Prosecutions (logged) Coeff Exp(B) SE p-value Person-Month Sentences (logged) Coeff Exp(B) SE p-value")
11
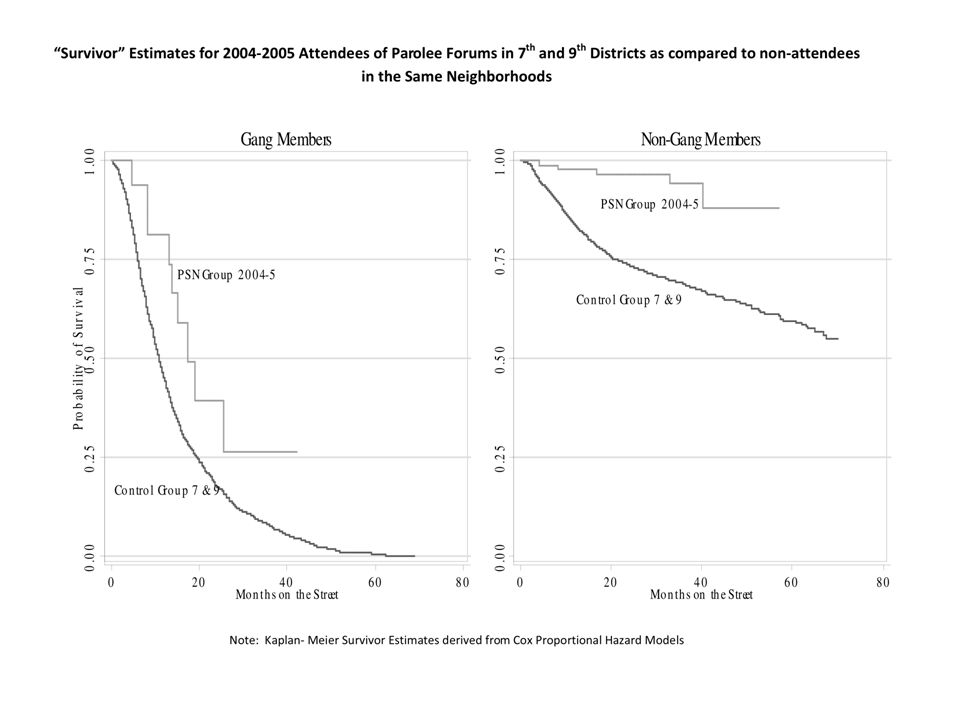
Recidivism Effects Methods and Data – Criminal history data on 3,092 ex-offenders from experimental and control Chicago police districts – Analyzed over four years to assess differences in timing of recidivism – Cox regressions – Disaggregated to examine separate effects on gang and non-gang members and first offenders versus repeat offenders – Disaggregate by type of crime

12
Propensity Scores ? Cox Models – S (t) = Pr (T > t) – Overlapping risks, neither competing nor exclusive – Covariates Race – African American Age – years Education – High school graduate Family ties – Married or cohabitating Prior record – first offense Gang member
 = Pr (T > t) – Overlapping risks, neither competing nor exclusive – Covariates Race – African American Age – years Education – High school graduate Family ties – Married or cohabitating Prior record – first offense Gang member.")
13
Sample ComparisonPSNTotal N2,677 (100) 415 (100) 3,092 (100) Male2,635 (98.4) 407 (98.1) 3,042 (98.4) African American2,531 (94.5) 383 (92.3) 2,914 (94.2) Age (mean)35.135.035.1 Married or Cohabitating208 (7.8) 18 (4.4) 226 (7.3) Prior Arrest1,185 (44.3) 277 (66.7) 1,462 (47.3) Gang Member1,297 (48.4) 91 (21.9) 1,388 (44.9) Any Recidivism950 (35.5) 67 (16.1) 1,107 (35.8)
 415 (100) 3,092 (100) Male2,635 (98.4) 407 (98.1) 3,042 (98.4) African American2,531 (94.5) 383 (92.3) 2,914 (94.2) Age (mean) Married or Cohabitating208 (7.8) 18 (4.4) 226 (7.3) Prior Arrest1,185 (44.3) 277 (66.7) 1,462 (47.3) Gang Member1,297 (48.4) 91 (21.9) 1,388 (44.9) Any Recidivism950 (35.5) 67 (16.1) 1,107 (35.8)")
16
Offense CategoryNon-GangGang All Crimes-1.547 (.38) -.839 (.20) Murder-43.74 (.005) -.287 (1.01) Total Violent Crime-.350 (.58) -.006 (.36) Property-Violent-.424 (.80) -1.467 (.66) Drug Sales-.193 (.71) -.145 (.23) Drug Possession-.355 (.37) -.145 (.23) Weapon-46.07 (.005).113 (.39) Drug Conspiracy.000 (1.52) 1.643 (.97) PSN Effects: Within-District Comparisons
 (.20) Murder (.005) (1.01) Total Violent Crime-.350 (.58) (.36) Property-Violent-.424 (.80) (.66) Drug Sales-.193 (.71) (.23) Drug Possession-.355 (.37) (.23) Weapon (.005).113 (.39) Drug Conspiracy.000 (1.52) (.97) PSN Effects: Within-District Comparisons")
17
Offense CategoryNon-GangGang All Crimes-1.649 (.40) -.795 (.19) Murder54.81 (1.00) -.276 (1.00) Total Violent Crime.290 (.61).404 (.37) Property-Violent.649 (.086) -.563 (.54) Drug Sales-.225 (.68).110 (.35) Drug Possession-.936 (-.586) -.586 (.22) Weapon-36.36 (.37).123 (.37) Drug Conspiracy-34.56 (1.52) 2.001 (.91) PSN Effects: Between-District Comparisons
 (.19) Murder54.81 (1.00) (1.00) Total Violent Crime.290 (.61).404 (.37) Property-Violent.649 (.086) (.54) Drug Sales-.225 (.68).110 (.35) Drug Possession-.936 (-.586) (.22) Weapon (.37).123 (.37) Drug Conspiracy (1.52) (.91) PSN Effects: Between-District Comparisons")
18
Offense CategoryRepeatersFirst Offenders All Crimes-.945 (.18) -37.29 (.19) Murder-.559 (1.03) -36.94 (1.01) Total Violent Crime-.070 (.31) -34.27 (.44) Property-Violent-.987 (.50) Drug Sales-.392 (.33) Drug Possession-.106 (.20) -41.88 (.30) Weapon-.357 (.38) Drug Conspiracy-1.643 (.097).000 (.00) PSN Effects: Between-District Comparisons – First Offenders versus Priors
 (.19) Murder-.559 (1.03) (1.01) Total Violent Crime-.070 (.31) (.44) Property-Violent-.987 (.50) Drug Sales-.392 (.33) Drug Possession-.106 (.20) (.30) Weapon-.357 (.38) Drug Conspiracy (.097).000 (.00) PSN Effects: Between-District Comparisons – First Offenders versus Priors")
19
Next Steps Competing risk hazards model More detail on prior records Temporal analysis to estimates effects of degrading of intervention Contemporaneous neighborhood change

Similar presentations


>")
 for Understanding the role of offender’s criminal history in violence against the police Donald Faggiani, University of Wisconsin.>")


