Download presentation
Presentation is loading. Please wait.

1
The Conceptualization and Validation of the Vanderbilt Assessment of Leadership in Education (VAL-ED) Ellen Goldring, Vanderbilt University Henry May, University of Pennsylvania June 2010
 Ellen Goldring, Vanderbilt University Henry May, University of Pennsylvania June 2010")
2
The Goal – Produce a Psychometrically Sound Assessment of School Leadership The team – Andy Porter, Joe Murphy, Ellen Goldring, Steve Elliott, Xiu Cravens, Morgan Polikoff, Henry May, Funding: The Wallace Foundation and IES

3
Acknowledgments The VAL-ED instrument is published and distributed by Discovery Education Assessment. We are authors of the VAL-Ed, and while we have made every effort to be objective and data- based in my statements about this instrument in this presentation, readers should judge the facts and related information materials for themselves and make independent decisions regarding the use of the instrument.

4
The Case for Leadership Assessment Most school leadership improvement focuses on professional development, mentoring, licensing policies, and standards. Minimal attention has been paid to assessment, feedback, and subsequent action. Leadership assessment and feedback is an important missing link to improving and strengthening school leadership. Assess behaviors associated with student achievement and learning

5
Learning –Centered Leadership Staying consistently focused on learning, teaching, curriculum, and assessment Making all the other dimensions of schooling (e.g., administration, organization, finance) work in the service of improved student learning
 work in the service of improved student learning")
6
Leadership Behavior Framework

7
Definitions of Core Components High Standards for Student Learning —There are individual, team, and school goals for rigorous student academic and social learning. Rigorous Curriculum (content) —There is ambitious academic content provided to all students in core academic subjects. Quality Instruction (pedagogy) —There are effective instructional practices that maximize student academic and social learning. Culture of Learning & Professional Behavior —There are integrated communities of professional practice in the service of student academic and social learning. There is a healthy school environment in which student learning is the central focus. Connections to External Communities —There are linkages to family and/or other people and institutions in the community that advance academic and social learning. Performance Accountability — Leadership holds itself and others responsible for realizing high standards of performance for student academic and social learning. There is individual and collective responsibility among the professional staff and students.
 —There is ambitious academic content provided to all students in core academic subjects. Quality Instruction (pedagogy) —There are effective instructional practices that maximize student academic and social learning. Culture of Learning & Professional Behavior —There are integrated communities of professional practice in the service of student academic and social learning. There is a healthy school environment in which student learning is the central focus. Connections to External Communities —There are linkages to family and/or other people and institutions in the community that advance academic and social learning. Performance Accountability — Leadership holds itself and others responsible for realizing high standards of performance for student academic and social learning. There is individual and collective responsibility among the professional staff and students..")
8
Definitions of Key Processes Planning—Articulate shared direction and coherent policies, practices, and procedures for realizing high standards of student performance. Implementing—Engage people, ideas, and resources to put into practice the activities necessary to realize high standards for student performance. Supporting—Create enabling conditions; secure and use the financial, political, technological, and human resources necessary to promote academic and social learning. Advocating—Promotes the diverse needs of students within and beyond the school. Communicating—Develop, utilize, and maintain systems of exchange among members of the school and with its external communities. Monitoring—Systematically collect and analyze data to make judgments that guide decisions and actions for continuous improvement.

9
The Need for a Valid and Reliable Principal Leadership Assessment Tool Virtually every school district in the United States (N = 14,000 school districts and over 90,000 schools) requires some form of evaluation of its principals. Many states and districts have developed their own leadership assessment tools. Our analysis of the assessments with large urban school districts indicates that few have a conceptual framework based on how leaders improve student learning, nor have they been validated for their intended uses.

10
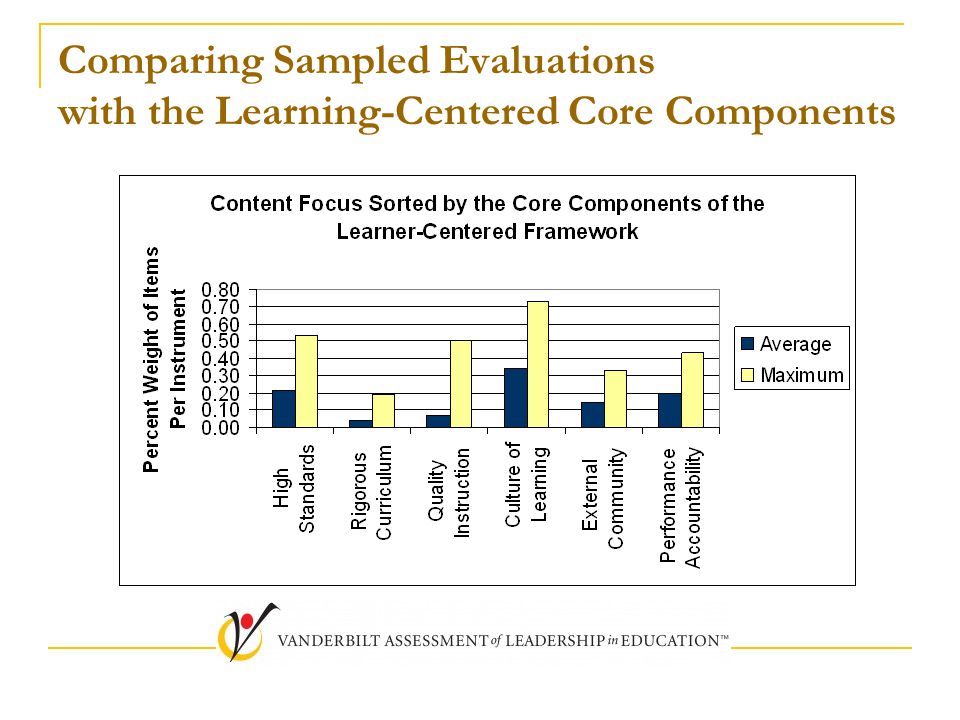
Comparing Sampled Evaluations with the Learning-Centered Core Components

12
From the sampled principal leadership assessment instruments, we find: Various levels of specificity Wide spread of assessed areas Limited depth Locally designed procedures for growth and development More on knowledge and skills, less on behavior Lack of consistent focus on school performance as measured by student achievement No psychometric development or reporting No 360 degree feedback

13
Assessing Learning-Centered Leadership: The VAL-ED vision… A leadership assessment system that has the following properties: Works well in a variety of settings and circumstances, Is construct valid, Is reliable, If feasible for widespread use, Provides accurate and useful reporting of results. Is unbiased, Yields a diagnostic profile for summative and formative purposes. Can be used to measure progress over time in the development of leadership, and Predicts important outcomes. Part of a comprehensive assessment of the effectiveness of a leader's behaviors

14
The VAL-ED Instrument

15
The instrument consists of 72 items defining six core component subscales and six key process subscales. Principal, Teachers, & Supervisor provide a 360-degree, evidenced-based assessment of leadership behaviors. Respondents rate effectiveness of 72 behaviors on scale 1=Ineffective to 5=Outstandingly effective. Each respondent rates the principal’s effectiveness after indicating the sources of evidence on which the effectiveness is rated. Two parallel forms of the assessment facilitate measuring growth over time. The instrument is available in both paper and online versions.

16
Directions for Completing Rating Scale

17
An Example Set of Responses

18
Interpretation of Rating Scale Results Descriptive Analysis Total Score Core Components Subscale Scores Key Process Subscale Scores Norm-Referenced Profiles Principal Teacher Supervisor Total respondent composite Criterion-Referenced Profiles Distinguished Proficient Basic Below basic

19
Aggregated Effectiveness Ratings

23
Leadership Behaviors for Possible Improvement Example of a potential area of growth:

24
Instrument Development and Early Studies of Psychometric Properties

25
Psychometric Piloting Item sorting study Established content validity by asking education leaders to sort the items into 36 cells. Cognitive interviews of paper/pencil version Two rounds of cognitive interviews in three districts each. Three respondents evaluated the format and items. Nine-school pilot test (320/440 teachers = 73%) Estimated reliability of each of 12 scales. Established construct validity through factor analysis. Established face validity through questions to respondents. Bias review Submitted to urban districts to evaluate language;
 Estimated reliability of each of 12 scales. Established construct validity through factor analysis. Established face validity through questions to respondents. Bias review Submitted to urban districts to evaluate language;.")
26
VAL-ED Field Test Target of 300 Schools 100 elementary, 100 middle, 100 high schools 150 urban schools, 100 suburban schools, 50 rural schools Of the 150 urban schools, 50 from Wallace grantee districts and 50 from Wallace grantee states 75 schools from each of four geographic areas The Obtained Sample 60 districts (9 Wallace districts) 235 schools for principal data, 253 schools for supervisor data, 245 schools for teachers data (w/ fairly even distribution across grade levels) 8,863 teachers 218 schools for which there was data from all three respondent groups 50% of the schools had a 68 percent teacher response or better
 235 schools for principal data, 253 schools for supervisor data, 245 schools for teachers data (w/ fairly even distribution across grade levels) 8,863 teachers 218 schools for which there was data from all three respondent groups 50% of the schools had a 68 percent teacher response or better")
27
Reliability Internal Consistency – Internal consistency reliability was high for both total score and each of the core components and each of the key processes with all reliabilities.87 or higher. Reliability of differences among core components and among key processes Contrasts among Culture of Learning, External Communities, Performance Accountability, and Rigorous Curriculum were all good, ranging from.35 to.92. For key processes, Supporting and Advocating could each be reliably contrasted with the other key processes, with reliabilities ranging from.25 to.92.

28
Factor Analyses to Investigate the Conceptual Framework Confirmatory factor analysis provided support for both core components and key processes, despite high co-linearity among the core components and among the key processes. Exploratory factor analysis with oblique rotation yielded an 8-factor solution with fairly consistent results between Forms A and C. There was considerable support for the core components of Performance Accountability and Connections to External Communities and some support for the core component of Culture of Learning and Professional Behavior. There was also support for the key process of Supporting and the key process of Advocating.

29
Correlations among Response Groups For total score, the correlation between principal and supervisor was.13, principal and teacher.27, supervisor and teacher.18. For core components, the average correlation between teacher and principal was.26, between teacher and supervisor.19, and supervisor and principal.13. For key processes, the average correlation was.27 between principal and teacher,.17 between supervisor and teacher, and.13 between principal and supervisor.

30
Performance Level Descriptors Distinguished A distinguished leader exhibits learning centered leadership behaviors at levels of effectiveness that are virtually certain to influence teachers positively and result in strong value-added to student achievement and social learning for all students. Proficient A proficient leader exhibits learning centered leadership behaviors at levels of effectiveness that are likely to influence teachers positively and result in acceptable value-added to student achievement and social learning for all students. Basic A leader at the basic level of proficiency exhibits learning centered leadership behaviors at levels of effectiveness that are likely to influence teachers positively and result in acceptable value-added to student achievement and social learning for some sub-groups of students, but not all. Below basic A leader at the below basic level of proficiency exhibits learning centered leadership behaviors at levels of effectiveness that are unlikely to influence teachers positively nor result in acceptable value-added to student achievement and social learning for students.

31
The Bookmark Procedure Twenty-two panelists: Ten principals, four teachers, four supervisors of principals, two researchers of school leadership, and two education policymakers Item-ordered booklet based on the National Field Trial (items from Form A) The cut between proficient and basic was set at 3.60. The cut between distinguished and proficient was set at 3.77. The cut between basic and below basic was set at 3.42. The impact data are 30% of the principals fall below basic 50% fall below proficient 70% fall below distinguished

32
Ongoing Validity Studies

33
Evidence Based on Relations to Other Variables #7. Known groups study: Select two groups characterized by previous assessments as highly effective or minimally effective leaders and compare their VAL-ED results. #8. Correlational study: Explore the corrections among principals' VAL-ED scores, schools' AYP gains over 3 years, school size, and percent of students receiving free or reduced lunch. Evidence Based on Consequences of Testing #9. Consequences survey study: Conduct a post-assessment report survey of principals to determine the consequences of the assessment for their leadership development and practices. Reliability Estimates #10. Internal consistency study: Computed Cronbach alphas for each respondent form used in the 9-school pilot study. Also will be repeated with the national field trial sample. #11. Retest/Stability study: Select a subset of respondents (principals, teachers, & supervisors) to complete the VAL-ED at two points in time, half the sample 1 month apart and remaining half of the sample 1 year apart. Calculate the correlation and degree of agreement between Time 1 and Time 2 ratings. #12. Equivalent forms study: Using a randomly selected subset of respondents (principals, supervisors, and teachers) who complete both form A and C of VAL-ED within a week, correlate the results within respondent group to determine the degree of association between both forms. #13. Convergent/Divergent Validity: A measure of instructional leadership and a measure of general leadership.
 to complete the VAL-ED at two points in time, half the sample 1 month apart and remaining half of the sample 1 year apart. Calculate the correlation and degree of agreement between Time 1 and Time 2 ratings. #12. Equivalent forms study: Using a randomly selected subset of respondents (principals, supervisors, and teachers) who complete both form A and C of VAL-ED within a week, correlate the results within respondent group to determine the degree of association between both forms. #13. Convergent/Divergent Validity: A measure of instructional leadership and a measure of general leadership..")
Similar presentations


 Ann Ooms (Kingston College, UK) Joan Garfield (Univ. of Minnesota, USA) Beth Chance (Cal Poly State Univ., USA)>")


