Download presentation
Presentation is loading. Please wait.

1
Update of the Domestic Exploration and Production Sector What’s Different Now? Dave Donegan Sinclair Oil & Gas Co. Idaho Petroleum Marketers and C-Store Associations Annual Meeting Sun Valley, ID – Thursday August 1, 2013

2
© Sinclair 2011. All rights reserved 2 Upstream subsidiary of a private integrated oil company – primary objective is attractive rate of return projects in US. Sinclair Oil & Gas Company

3
© Sinclair 2011. All rights reserved 3 Our Strategy Focus on unconventional reservoirs with low geologic risk and lots of running room – in particular we target “shale plays” Opportunistic rather than geographic strategy Small staff but leverage geologic expertise in shale reservoirs and operational expertise in horizontal drilling and multi-stage hydraulic fracture stimulation

4
© Sinclair 2011. All rights reserved 4 Our Strategy (cont.) Current activity in Bakken (MT/ND), Woodford (OK), Wolfcamp/Cline (TX), Cain and A1 Carbonate (MI). Looking for new opportunity. Typically try to partner with other operators, enter plays early, but not first. Partner of choice!
 Current activity in Bakken (MT/ND), Woodford (OK), Wolfcamp/Cline (TX), Cain and A1 Carbonate (MI). Looking for new opportunity. Typically try to partner with other operators, enter plays early, but not first. Partner of choice!.")
5
© Sinclair 2011. All rights reserved 5 Mature Oil Early Development Nat. Gas Mature Nat. Gas Test Stage Oil

6
© Sinclair 2011. All rights reserved 6

7
7

8
8

9
9

10
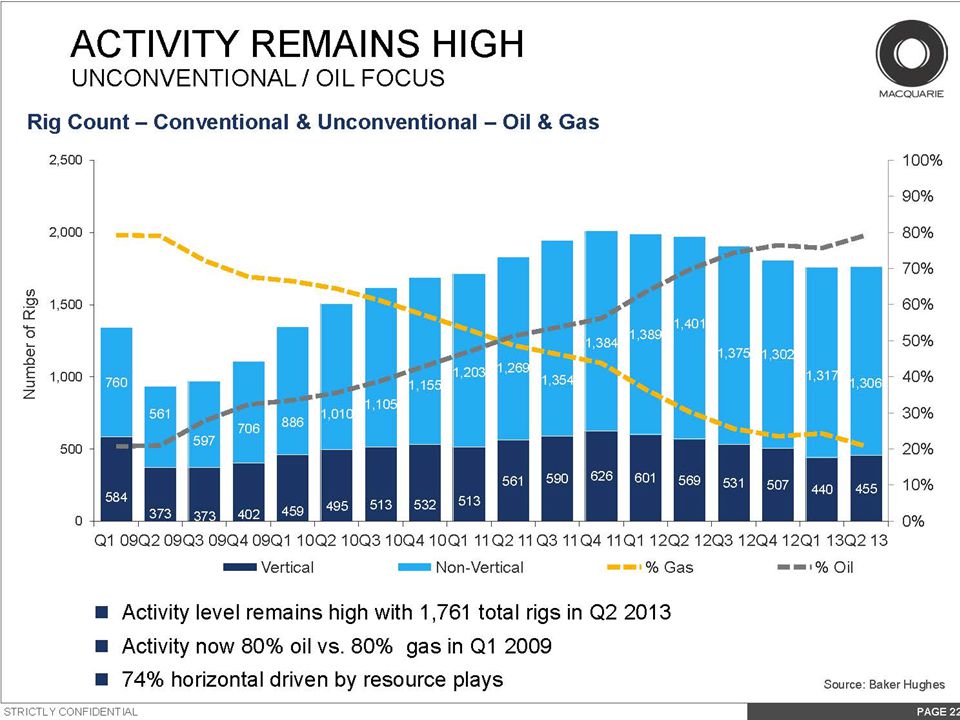
10 Story of the past five years is the dramatic increase in North American crude oil and natural gas production. Why? Multi-stage frac completions in horizontal wells drilled in unconventional reservoirs (primarily shale's). Crude prices have remained remarkably stable over the past year in the face of a long list of supply disruptions, from Nigerian oil theft and Syrian civil war to an export standoff between Sudan and South Sudan. The reason in large part is a thick new blanket of North American oil cushioning the markets.
. Crude prices have remained remarkably stable over the past year in the face of a long list of supply disruptions, from Nigerian oil theft and Syrian civil war to an export standoff between Sudan and South Sudan. The reason in large part is a thick new blanket of North American oil cushioning the markets..")
11
© Sinclair 2011. All rights reserved 11 Cross-section of a Typical Horizontal Well Source: Anadarko

12
© Sinclair 2011. All rights reserved 12

13
© Sinclair 2011. All rights reserved 13 The Shale Gale delivered rapid U.S. production increases - & precipitated gas price collapse Henry Hub monthly average cash price September 2012 64.7 Bcf per day NGL-and oil-rich plays begins to drive third wave Avg $7.45 Jan 04 to Dec 08 Source: Courtesy Pete Stark IHS, CERA, Intelligence Press, and EIA Hurricanes Katrina, Rita Shale Gale starts with Barnett, Fayetteville, and Woodford shale plays Hurricane Ike July 2008 56.1 Bcf per day Avg $3.75 Jan 09 to Sept 12 Haynesville, Marcellus Shale plays drive second wave

14
© Sinclair 2011. All rights reserved 14 Domestic production of shale gas has grown dramatically over the past few years

15
© Sinclair 2011. All rights reserved 15 North America Key Gas Plays 2009-2012 (June) Gas Wells Source: Courtesy Pete Stark - IHS
 Gas Wells Source: Courtesy Pete Stark - IHS.")
16
© Sinclair 2011. All rights reserved 16 Spot natural gas prices vary significantly across global markets since 2008, with many markets far below oil –related benchmarks Source: Courtesy Pete Stark - IHS

17
© Sinclair 2011. All rights reserved 17 Shale Gale Natural Gas Game Changer Scorecard Major competitive advantages for the U.S. economy Jobs: 2012 = 900,0002035 = 2.1 million GDP: $122 billion2035 = $287 billion Taxes: 2012 = $31 billion2035 = $73 billion Offset ~ 10 Bcfd of LNG imports to NAM NAM poised to launch LNG exports But Canada gas exports to U.S. decrease 4 Bcfd (32%) Low priced gas facilitates transformation to clean energy Low priced gas helping to drive major petrochemical investments and reviving energy dependent manufacturing Source: Courtesy Pete Stark - IHS
 Low priced gas facilitates transformation to clean energy Low priced gas helping to drive major petrochemical investments and reviving energy dependent manufacturing Source: Courtesy Pete Stark - IHS.")
18
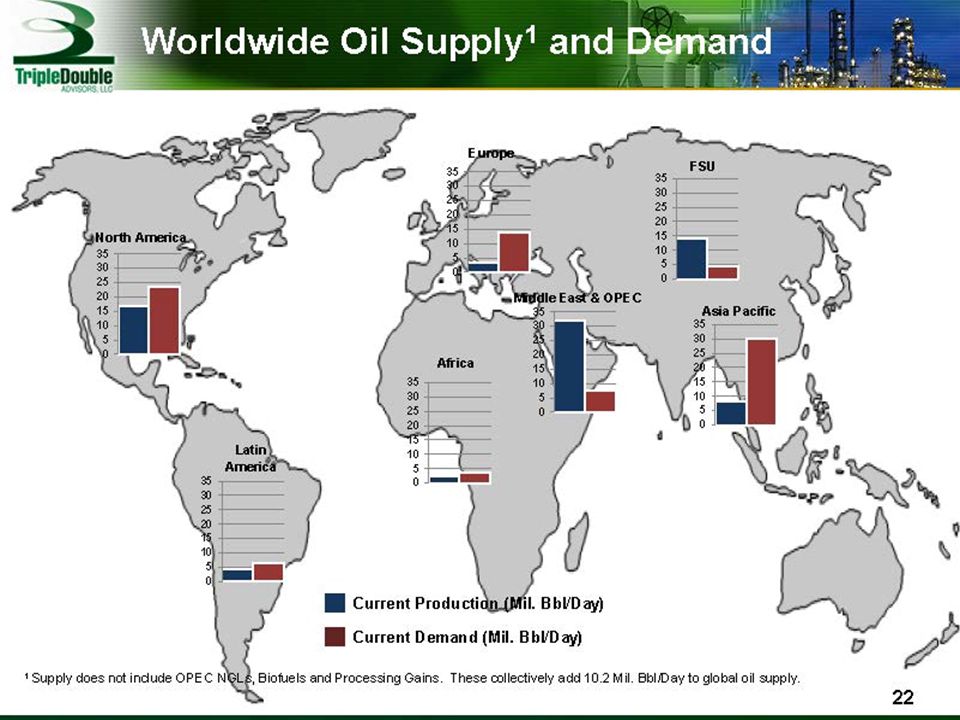
© Sinclair 2011. All rights reserved 18 U.S. dependence on imported liquids depends on both supply and demand

19
© Sinclair 2011. All rights reserved 19 Non-OECD liquid fuels use surpasses almost flat OECD liquid fuels use in the near future

20
© Sinclair 2011. All rights reserved 20 Liquids fuel consumption in the United States, China, and India, 1990-2040

21
© Sinclair 2011. All rights reserved 21 World oil prices move together due to arbitrage

22
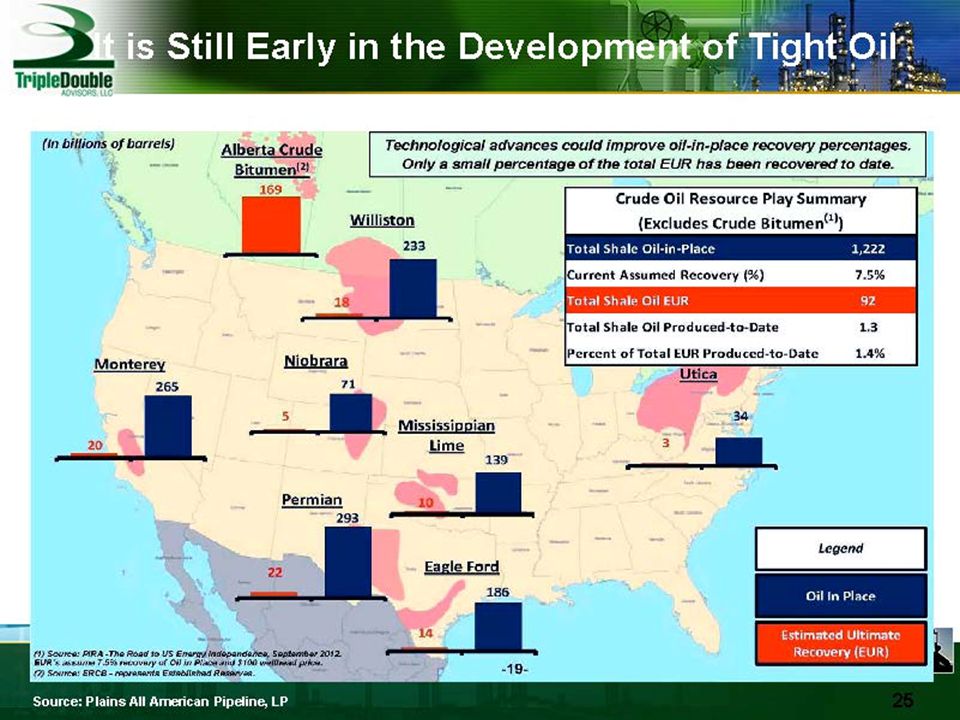
© Sinclair 2011. All rights reserved 22 Domestic production of tight oil has grown dramatically over the past few years

23
© Sinclair 2011. All rights reserved 23 Key Tight Oil Plays North America Oil & Horizontal Wells 2010-2012 Source: Courtesy Pete Stark - IHS

24
© Sinclair 2011. All rights reserved 24 Selected U.S. Tight Oil Plays Horizontal Oil Well Average Oil + Gas IP (boe/d) Source: Courtesy Pete Stark - IHS
 Source: Courtesy Pete Stark - IHS.")
25
© Sinclair 2011. All rights reserved 25 Tight Oil Upside Potential Increase in High Volume Wells > 1,000 b/d Source: Courtesy Pete Stark - IHS

26
© Sinclair 2011. All rights reserved 26 Tight Oil Upside Potential is Growing Continuous process improvements – lower costs & increase recoveries Confirm new reservoirs in established plays: Bakken / Three Forks: 2012 three primary reservoirs; 2013 three new Three Forks reservoirs plus Bakken silt technically recoverable resource @ 3.5% RF +~ 12 Bboe (60%) Niobrara: 2012 one primary reservoir; 2013 four primary reservoirs: Increase reserves ~ 1.3 Bboe Wolfcamp: 2012 one primary reservoir; 2013 three – four primary reservoirs, potential increase of > 5Bboe New Play fairways – S. OK Oil Province, Lower Woodford Continental Resources - ~2 Bboe (~4 Bboe for fairway) Source: Courtesy Pete Stark - IHS
 Niobrara: 2012 one primary reservoir; 2013 four primary reservoirs: Increase reserves ~ 1.3 Bboe Wolfcamp: 2012 one primary reservoir; 2013 three – four primary reservoirs, potential increase of > 5Bboe New Play fairways – S. OK Oil Province, Lower Woodford Continental Resources - ~2 Bboe (~4 Bboe for fairway) Source: Courtesy Pete Stark - IHS.")
27
© Sinclair 2011. All rights reserved 27 Source: NDIC

28
© Sinclair 2011. All rights reserved 28 ND Drilling Stats Source: JJ Kringstad – North Dakota Pipeline Authority

29
© Sinclair 2011. All rights reserved 29 ND Oil Pricing: ND-WTI Differential Source: EIA Data

30
© Sinclair 2011. All rights reserved 30 US Williston Basin Oil Transport* *Some data based on estimates or assumptions Source: JJ Kringstad – North Dakota Pipeline Authority

31
© Sinclair 2011. All rights reserved 31 The Tight Oil Revolution Scorecard Updated U.S. supply view – plateau ~ 4.5 MMbd 2023 What does this mean to U.S. economy? $5 Tr investment Jobs: 2012 = 800,0002035 = 1.4 million GDP: 2012 = $116 billion2035 = $188 billion Taxes: 2012 = $30 billion2035 = $51 billion Dramatic decrease in U.S. oil imports In 2005 U.S. net oil imports = 12.2 mbd or 58% of demand. By 2020 U.S. net import requirement will shrink to 30% of demand. (Most of the net imports will be from Canada and Mexico) Huge implications for energy security and the economy North America tight oil is a model for global potential Source: Courtesy Pete Stark - IHS
 Huge implications for energy security and the economy North America tight oil is a model for global potential Source: Courtesy Pete Stark - IHS.")
32
© Sinclair 2011. All rights reserved 32 Bakken-Three Forks Williston Basin Tight Oil Upside Potential New Reservoirs in Established Plays Source: IHS

33
© Sinclair 2011. All rights reserved 33 Source: Macquarie Capital (USA), IHS, EIA – July 2012 Finding & Development Costs Trending Higher
, IHS, EIA – July 2012 Finding & Development Costs Trending Higher.")
34
© Sinclair 2011. All rights reserved 34 The Market Environment What has changed since 2012? Source: Courtesy Pete Stark - IHS 2Q12vs.2Q13

35
© Sinclair 2011. All rights reserved 35 Conclusions Fossil fuels are expected to provide the majority of U.S. energy supplies for the foreseeable future. Domestic supply of North American crude oil and natural gas has increased dramatically over the past five years and is expected to continue – This was the big surprise. Economic benefit to the U.S. of a healthy domestic exploration and production sector is critical to U.S. economic and security objectives. The impact is measurable and significant.

36
Update of the Domestic Exploration and Production Sector What’s Different Now? Dave Donegan Sinclair Oil & Gas Co. Idaho Petroleum Marketers and C-Store Associations Annual Meeting Sun Valley, ID – Thursday August 1, 2013

Similar presentations


 could.>")


>")
