Download presentation
Presentation is loading. Please wait.

1
Who is Coming to College? 2012 CIRP Freshman Survey Results
John H. Pryor Director, Cooperative Institutional Research Program Higher Education Research Institute at UCLA

2
Higher Education Research Institute
We believe in the transformative power of higher education

3
CIRP Freshman Survey Comprehensive survey of incoming first-time full-time college students at four-year institutions Beginning of longitudinal research program that continues with the YFCY, DLE, and CSS 47th year and over 15 million students total

4
CIRP Freshman Survey 2012 Administered at “Norms”
389 four-year institutions 236,937 students “Norms” 283 four-year institutions 192,912 students Weighted to 1.5 million entering four-year institutions

5
CIRP Conceptual Framework
Student experience is comprehensive, multifaceted and inter-related, not focused on one or two issues Look at cognitive and affective domains Collect data that is: Behavioral (what students do, i.e., study, interact, etc) Psychological (attitudes, values, self-concept) Environmental (campus climate, residence type)
 Psychological (attitudes, values, self-concept) Environmental (campus climate, residence type)")
6
Astin’s I-E-O Model ENVIRONMENT YFCY/DLE/CSS INPUT OUTCOME
(e.g., residence, interactions with peers and faculty, curricular and co-curricular experiences) INPUT CIRP Freshman Survey (previous academic performance, financial concerns, expectations, degree aspirations, self-concept in high school, race, sex) OUTCOME YFCY/DLE/CSS (gains in college, satisfaction with college, retention, post-college plans)
 INPUT. CIRP Freshman Survey. (previous academic performance, financial concerns, expectations, degree aspirations, self-concept in high school, race, sex) OUTCOME. YFCY/DLE/CSS. (gains in college, satisfaction with college, retention, post-college plans)")
7
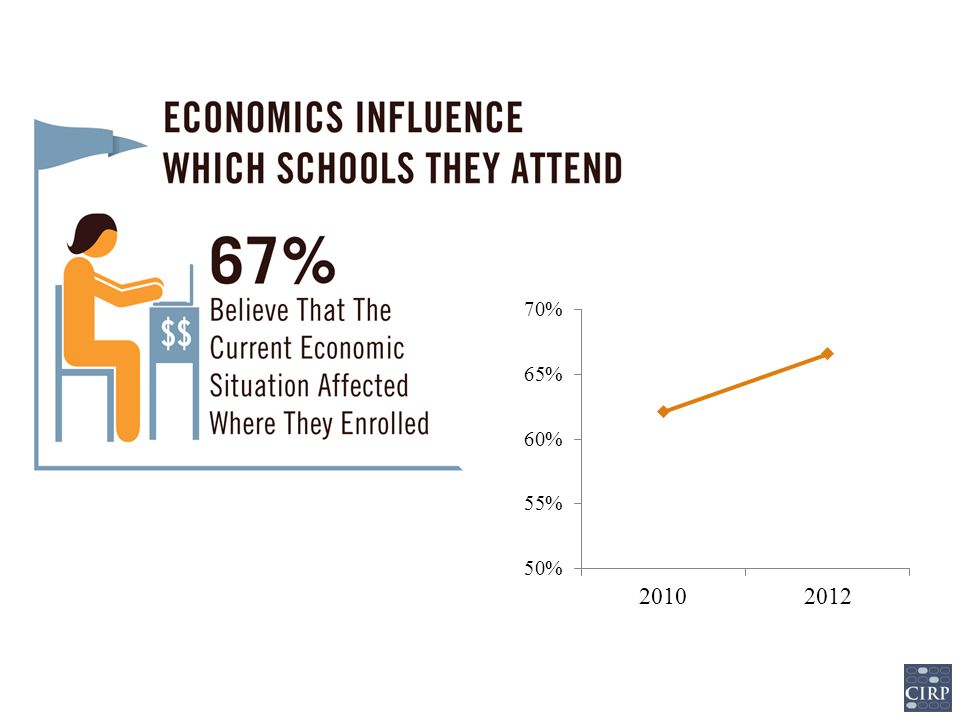
Impact of Economics Expectations and Reality of Time to Graduation Support of Same-Sex Marriage Political Views and Orientation between 2008 and 2012 Revised Majors in 2012 Pre-Med or Pre-Law Track Differences in Math Preparation Specific Habits of Mind on the Rise Feeling Overwhelmed as High School Seniors Where Students Reside

8
Impact of Economics Expectations and Reality of Time to Graduation Support of Same-Sex Marriage Political Views and Orientation between 2008 and 2012 Revised Majors in 2012 Pre-Med or Pre-Law Track Differences in Math Preparation Specific Habits of Mind on the Rise Feeling Overwhelmed as High School Seniors Where Students Reside

11
Reasons to go to College (% Indicating “Very Important”)
")
13
Most important objective: Being well off financially

14
Most important objective: Being well off financially

15
Increased Importance of Financial Reasons (% Indicating “Very Important”)
")
17
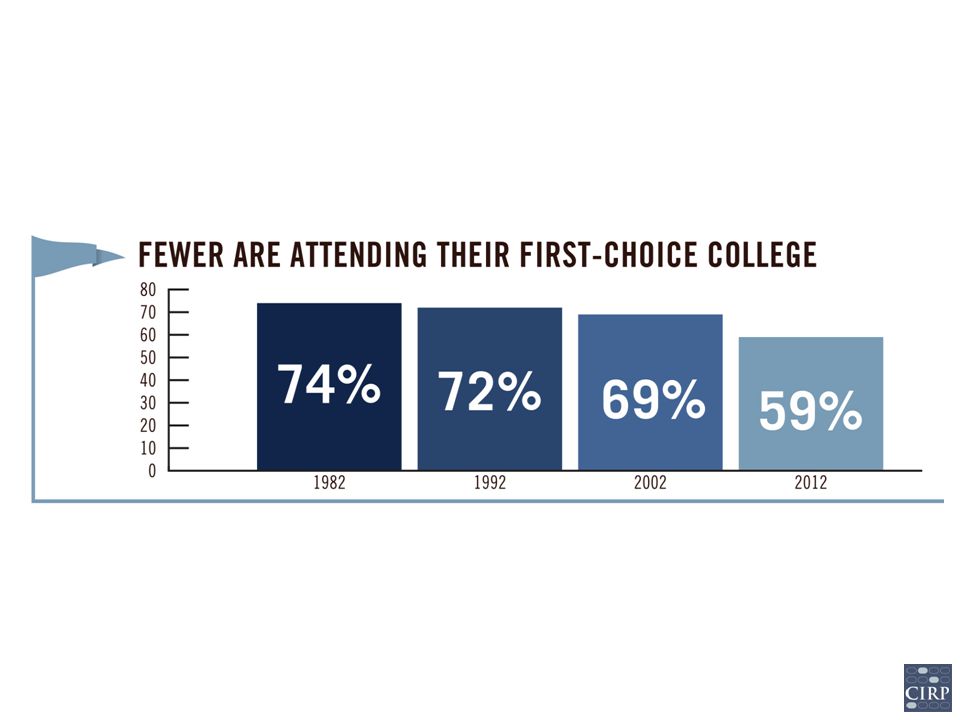
The First Choice Gap Gap increased from 16.5% in 2007 to 17.4% in 2012

18
Impact of Economics Expectations and Reality of Time to Graduation Support of Same-Sex Marriage Political Views and Orientation between 2008 and 2012 Revised Majors in 2012 Pre-Med or Pre-Law Track Differences in Math Preparation Specific Habits of Mind on the Rise Feeling Overwhelmed as High School Seniors Where Students Reside

19
Time to Degree New in 2012 “How many years do you expect it will take you to graduate from this college?” Importance in college choice: “The percentage of students who graduate from this college”

22
Time to Degree Only 8.6% believe they will take 5 years
National figure is 15.8% 2.7% believe they will take 6 years National figure is 4.5%

23
5yr Degree and Prospective Major
19.1% Engineering 14.0% English Public Private College 11.3% 4.3% University 7.8% 15.0%

24
30.4% Time to Degree “The percentage of students that
graduate from this college” was “very important” to only 30.4% 23 reasons…this is number 9

25
Impact of Economics Expectations and Reality of Time to Graduation Support of Same-Sex Marriage Political Views and Orientation between 2008 and 2012 Revised Majors in 2012 Pre-Med or Pre-Law Track Differences in Math Preparation Specific Habits of Mind on the Rise Feeling Overwhelmed as High School Seniors Where Students Reside

26
Support for Same-Sex Marriage (% Indicating “Agree Strongly” or “Agree Somewhat”)
")
27
Support for Same-Sex Marriage
(% Indicating “Agree Strongly” or “Agree Somewhat”)
")
28
Impact of Economics Expectations and Reality of Time to Graduation Support of Same-Sex Marriage Political Views and Orientation between 2008 and 2012 Revised Majors in 2012 Pre-Med or Pre-Law Track Differences in Math Preparation Specific Habits of Mind on the Rise Feeling Overwhelmed as High School Seniors Where Students Reside

30
Political Orientation in 2008 and 2012, by Sex

31
Support for Social and Political Views, by Year (% Indicating “Agree Strongly” or “Agree Somewhat”)
")
32
Wealthy Should Pay More Taxes
(% Indicating “Agree Strongly” or “Agree Somewhat”)
")
33
Impact of Economics Expectations and Reality of Time to Graduation Support of Same-Sex Marriage Political Views and Orientation between 2008 and 2012 Revised Majors in 2012 Pre-Med or Pre-Law Track Differences in Math Preparation Specific Habits of Mind on the Rise Feeling Overwhelmed as High School Seniors Where Students Reside

34
Updated Majors Reflect contemporary majors
Biology (from 8 to 12) Engineering (from 8-13) Business (from 8 – 12) No large changes between categories Business continues to be the largest (14.4%) 14.1% Health professions 12.6% Biological sciences 10.4% Engineering
 Engineering (from 8-13) Business (from 8 – 12) No large changes between categories. Business continues to be the largest (14.4%) 14.1% Health professions. 12.6% Biological sciences. 10.4% Engineering.")
35
Impact of Economics Expectations and Reality of Time to Graduation Support of Same-Sex Marriage Political Views and Orientation between 2008 and 2012 Revised Majors in 2012 Pre-Med or Pre-Law Track Differences in Math Preparation Specific Habits of Mind on the Rise Feeling Overwhelmed as High School Seniors Where Students Reside

36
New for 2012 19.3% Pre-med 6.3% Pre-law

37
Academic Major Intentions among Pre-Med and Pre-Law Students
Biological & Life Sciences 43.7 2.7 Health Professions 31.7 1.5 Social Science 5.7 12.7 Undecided 4.3 6.7 Engineering 3.7 2.4 Physical Science 0.7 Other (Agriculture, Education, English, Fine Arts, Math/Computer Scienced, Library Science, Other Non-technical) 3.6 9.0 Business 1.7 18.1 Arts & Humanities 0.9 5.0 History or Political Science 0.4 26.6 Justice and Security 14.6
 Business Arts & Humanities History or Political Science Justice and Security")
38
HBCU Differences Historically Black Colleges and Universities enroll the largest percentage of both Pre-med 22.9% vs 19.3% Pre-law 10.5% vs 6.3%

39
Occupational Connections
Pre-med 35.7% Physicians 11.7% Nurses 2.1% Research Scientists

40
Occupational Connections
Pre-law 46.8% Attorney 11.3% Business 6.8% Law enforcement 5.1% Government

41
Impact of Economics Expectations and Reality of Time to Graduation Support of Same-Sex Marriage Political Views and Orientation between 2008 and 2012 Revised Majors in 2012 Pre-Med or Pre-Law Track Differences in Math Preparation Specific Habits of Mind on the Rise Feeling Overwhelmed as High School Seniors Where Students Reside

42
New for 2012 Historically asked how many years of a subject (English, Math, Music, etc) recommended years in Nation at Risk Research on math level indicates a connection with retention
 recommended years in Nation at Risk Research on math level indicates a connection with retention")
43
Type of High School Math Courses Completed

44
Type of High School Math Courses Completed, by Pre-Med Intention

45
Impact of Economics Expectations and Reality of Time to Graduation Support of Same-Sex Marriage Political Views and Orientation between 2008 and 2012 Revised Majors in 2012 Pre-Med or Pre-Law Track Differences in Math Preparation Specific Habits of Mind on the Rise Feeling Overwhelmed as High School Seniors Where Students Reside

47
Slight Rise in Selected Habits of Mind (% Indicating “Frequently” or “Occasionally”)
")
48
Impact of Economics Expectations and Reality of Time to Graduation Support of Same-Sex Marriage Political Views and Orientation between 2008 and 2012 Revised Majors in 2012 Pre-Med or Pre-Law Track Differences in Math Preparation Specific Habits of Mind on the Rise Feeling Overwhelmed as High School Seniors Where Students Reside

50
Trend of “Felt Overwhelmed by All I Had to Do” (% Indicating “Frequently”)
")
51
Felt Overwhelmed by All I had To Do
(% Indicating “Frequently”)
")
52
Impact of Feeling Overwhelmed

53
Impact of Economics Expectations and Reality of Time to Graduation Support of Same-Sex Marriage Political Views and Orientation between 2008 and 2012 Revised Majors in 2012 Pre-Med or Pre-Law Track Differences in Math Preparation Specific Habits of Mind on the Rise Feeling Overwhelmed as High School Seniors Where Students Reside

54
Living Plans for Fall

55
Students Living with Family
Important factor in college choice Cost (57.3% vs 40.1%) Live near home (49.0% vs 13.7%) Financing college Using loans (48.7% vs 62.3%) Not using any family resources (21.1% vs 12.7%)
 Live near home (49.0% vs 13.7%) Financing college. Using loans (48.7% vs 62.3%) Not using any family resources (21.1% vs 12.7%)")
56
Students Living with Family
“Very good” chance of transfer 10.0% vs 5.2% Need extra time to complete degree 7.9% vs 5.4%

57
Conclusions Economic impact intensifies
All time highs At the same time, few see time to degree as important as it should be Students identify more with “middle of the road” politically, yet hold liberal views More students entering having felt overwhelmed

58
For More Information

Similar presentations


 Higher.>")

 UCLA’s Higher Education Research Institute COOPERATIVE INSTITUTIONAL RESEARCH PROGRAM (CIRP) Presentation.>")


