Download presentation
Presentation is loading. Please wait.

1
The Delaware Study Best Practices for Managing Costs and Productivity Assistant Director Office of Institutional Research University of Delaware Data Manager Delaware Study of Instructional Costs & Productivity Allison M. Walters awalters@udel.edu

2
Outline Delaware Study’s utility as a management tool What we know about comparing costs Examples of best practices

3
2011 Inside Higher Ed Survey of College and Univ Presidents Top two challenges: Publics: budget shortfalls (62%), changes in state support (43%) Privates: rising tuition/affordability (42%), increased competition for students (35%)
, changes in state support (43%) Privates: rising tuition/affordability (42%), increased competition for students (35%)")
4
2011 Inside Higher Ed Survey of College and Univ Presidents (cont.) Response: Public Doctoral: cuts to select academic programs (71%), laid off administrators (59%), increased tuition (59%) and fees (48%) Private Masters & Bacc: about half report tuition discount rates have increased as they’ve provided more financial aid to offset their higher tuitions.
 Response: Public Doctoral: cuts to select academic programs (71%), laid off administrators (59%), increased tuition (59%) and fees (48%) Private Masters & Bacc: about half report tuition discount rates have increased as they’ve provided more financial aid to offset their higher tuitions.")
5
The Delaware Study ~180-200 annual participants Benchmark teaching activity, instructional costs, and externally funded faculty scholarship, all at the discipline level Carnegie classification Highest degree Relative emphasis of undergraduate v. graduate instruction

6
2009 Delaware Study Participants States: UNC, PA, Univ of Nebraska, Univ of Missouri Groups: AAUDE, SUG PublicPrivate Research583 Doctoral101 Comprehensive4828 Baccalaureate1016 12648

7
The Delaware Study as a Management Tool To assess the relative position of academic departments and programs in relation to those at appropriate comparator institutions. Not intended to be used as a tool to reward or penalize programs, but rather to focus on strategies for program improvement. Understand – Compare – Evaluate Resources

8
Science Department

9
Teaching Load Data

10
More Teaching Load Data

11
Cost & Scholarly Productivity Data

12
Direct Instructional Costs 85% to 90% (on average) driven by faculty salaries. Tenured and tenure-track faculty are “fixed costs.” Difference in cost among institutions is due to the disciplines that comprise the curriculum within the institutions. Middaugh, M.F., Graham, R., & Shahid, A. (2003). A Study of Higher Education Instructional Expenditures: The Delaware Study of Instructional Costs and Productivity (NCES 2003-161). Washington, DC: U.S. Department of Education.
. A Study of Higher Education Instructional Expenditures: The Delaware Study of Instructional Costs and Productivity (NCES ). Washington, DC: U.S. Department of Education..")
13
Direct Expense per Student Credit Hour Taught: Institution Type Within Discipline, 2007

14
Direct Expense per Student Credit Hour Taught: Discipline Within Institution Type, 2007

15
Cost Factors Volume of teaching activity. Cost decreases as volume increases. Department size. The larger the department, the higher the cost. The proportion of faculty holding tenure. The higher the proportion of tenured faculty, the higher the cost. The presence of graduate instruction increases costs. Middaugh, M.F., Graham, R., & Shahid, A. (2003). A Study of Higher Education Instructional Expenditures: The Delaware Study of Instructional Costs and Productivity (NCES 2003-161). Washington, DC: U.S. Department of Education.
. A Study of Higher Education Instructional Expenditures: The Delaware Study of Instructional Costs and Productivity (NCES ). Washington, DC: U.S. Department of Education..")
16
Examples of Best Practices

17
University of Mississippi Dept X SUG Benchmark Total FTE Instructional Faculty 21.540.78 % T/TT Inst. FTE Faculty 60%49% % Ugrad SCH Taught by T/TT Faculty FTE (Instructional)55%48% % Grad SCH Taught by T/TT Faculty FTE (Instructional)100%92% % Ugrad SCH Taught by TA's (Credit-Bearing) 8%15% Total SCH per ALL Faculty FTE (Instructional) 243181 FTE Students Taught per T/TT Faculty FTE (Instructional)21.38.9 FTE Students Taught per ALL Faculty FTE (Instructional)16.211.9 Sections per Instructional T/TT Faculty FTE (Incl. Labs)42.8 Sections per ALL Instructional Faculty FTE (Incl. Labs)4.32.7
55%48% % Grad SCH Taught by T/TT Faculty FTE (Instructional)100%92% % Ugrad SCH Taught by TA s (Credit-Bearing) 8%15% Total SCH per ALL Faculty FTE (Instructional) FTE Students Taught per T/TT Faculty FTE (Instructional) FTE Students Taught per ALL Faculty FTE (Instructional) Sections per Instructional T/TT Faculty FTE (Incl. Labs)42.8 Sections per ALL Instructional Faculty FTE (Incl. Labs)")
18
University of Mississippi (cont.) Dept XSUG Benchmark Salary/Benefits as % of Total Budget 93%90% Expenditure per SCH $162$229 Expenditure per FTE Student $4,826$6,751
 Dept XSUG Benchmark Salary/Benefits as % of Total Budget 93%90% Expenditure per SCH $162$229 Expenditure per FTE Student $4,826$6,751")
19
New Mexico State University Key variables SCH/FTE faculty Cost/SCH Comparators Carnegie Research Class Land-Grants Departmental Budget Metrics Strategic Planning Academic Program Review

20
University of Colorado – Boulder http://www.colorado.edu/pba/course/delaware/ovv.htm Compare Colorado data to AAU To individual Colorado disciplines

21
University of North Carolina System Board of Governors monitors faculty teaching loads Faculty Teaching Workload Report

22
University of North Carolina System (cont.) Number of SCH within category to generate one additional faculty FTE. Category I: English, History, Math Category II: Business, Education, Foreign Languages Category III: Ag, Physical Sciences, Public Admin, Visual and Perf. Arts Category IV: Nursing and Engineering

23
University of North Carolina System (cont.)
")
24
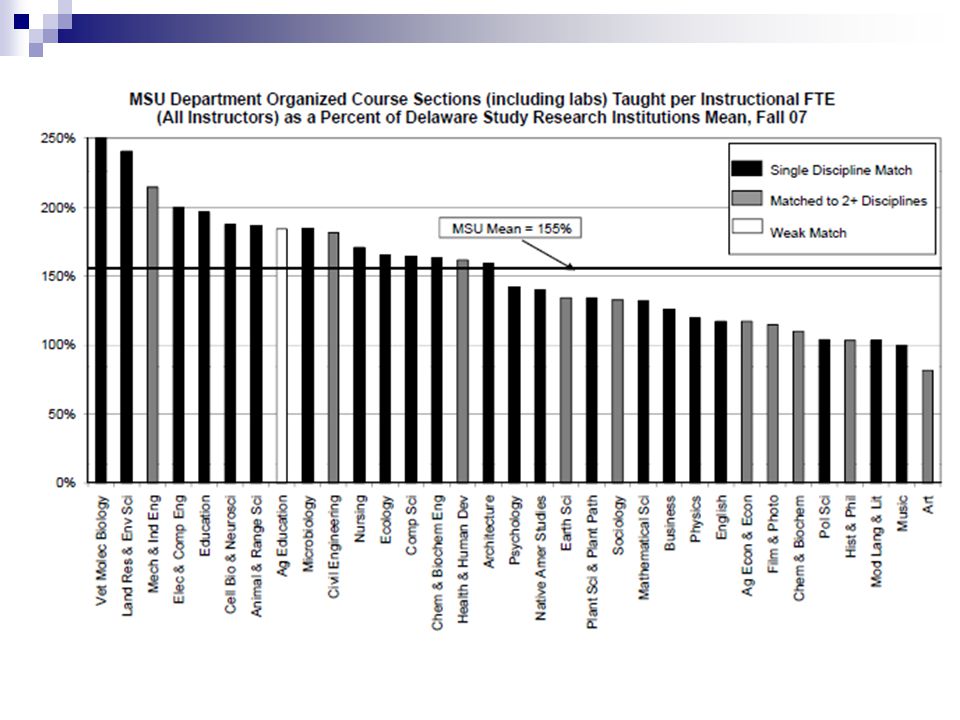
Montana State University Allocation of new faculty lines Doing “more with less”

30
University of West Georgia Group departments by level of teaching activity and cost

31
UWG: Total SCH per FTE Faculty (All Categories)
")
32
UWG: Total SCH Taught Per Faculty FTE (All Categories) - UWG as % of Comprehensive Universities & Colleges
 - UWG as % of Comprehensive Universities & Colleges")
33
UWG: Direct Instructional Expenditures per SCH

34
UWG: Direct Instructional Expenditures per SCH - UWG as % of Comprehensive Universities and Colleges

35
UWG: Classification of Faculty Teaching Loads & Instructional Expenditures by Department Direct Instructional Expenditures LowModerateHigh Teaching Loads Low Dept. PY3 Dept. NN1 Dept. PS1 Moderate Dept. AT2 Dept. CC1 Dept. EE3 Dept. PL3 Dept. SY3 Dept. PH2 High Dept. AP3; Dept. BY1; Dept. CP1; Dept. GS1 Dept. HS3; Dept. CM3 Dept. MA3; Dept. PP3 Dept. MM2

36
Allison M. Walters Assistant Director, Office of Institutional Research, University of Delaware Data Manager, Delaware Study of Instructional Costs & Productivity awalters@udel.edu 302-831-2021

Similar presentations


 and the Education Trust.>")


 per FTE T/TE Faculty compared to National Averages AnthBioChemComMathPhysPolSciPsySocStats.>")


