Download presentation
Presentation is loading. Please wait.

1
The 2015 Reno/Sparks Residential Resale Market Report Dave Hansen President Reno/Sparks Association of REALTORS® Coldwell Banker Select Real Estate www.rsar.net

2
A Little History First Let’s look at the NAR data and then Let’s look at the local data Some charts will be similar, but there are differences

3
Homeowner Households from 2010 (Decreased by 1 million) In thousands
 In thousands")
4
Renter Households from 2010 (Increased by 4 million) In thousands
 In thousands")
5
Nationwide Home Price Recovery (Almost Doubled over 20 years) FHFA Home Price Index
 FHFA Home Price Index")
6
Local Home Price Recovery

8
30-year Mortgage Rates

9
Value Is Again Supported By Sales

10
Is It a Seller or Buyer Market?

12
Market Rate Steady, Price Changes

13
Almost Constant Sales Appetite

14
Reno/Sparks Median Prices

19
New Listings Are Bouncing Back

20
New Pendings Are Down

21
Active Listings

22
Just who are these buyers? The National Association of REALTORS (NAR) creates a survey of buyers and sellers every year and we have pulled some interesting details out of these reports
 creates a survey of buyers and sellers every year and we have pulled some interesting details out of these reports.")
23
Price of Home Purchased Compared to Home Recently Sold Price of Home SoldPrice of Home Purchased Difference 32 and Younger$152,900$250,000$97,100 33 to 47$205,000$278,000$73,000 48 to 57$245,000$259,000$14,000 58 to 66$220,000$208,700-$11,300 67 to 87$199,800$175,700-$24,100 88 and Older$151,900$181,800$29,000

24
Sources of Down Payment 32 and Younger 33 to 4748 to 5758 to 6667 to 8788 and Older Savings80%71%54%50%44%62% Proceeds from Sale Residence 72431405145 Gift - friend or relative 271573210 401K/Pens ion Fund incl. loan 8131272* Sale of Stocks or Bonds 789712*

25
New Source of Down payment 2014 All BuyersFirst time BuyersRepeat Buyer Savings65%81%57% Proceeds of sale33247 Gift letter14268 401K/Pension/loan9108 Inheritance454 Loan relative/friend463 Equity loan2<13 Proceeds other than primary 2<13 Other7105

26
Reason for New vs. Resale Home 20132014 New Home16% Avoid renovations or problems with plumbing or electricity3240 Ability to choose and customize design features2524 Amenities of new home construction communities1417 Lack of inventory of previously owned homes10 Green/energy efficiency69 Previously Owned Home84% Better price30%32 Better overall value2832 More charm and character1719 Lack of inventory of new homes99

28
Distressed Sales Disappearing

29
Shrinking Shadow Inventory (but not in CT, NY, NJ)
")
31
2013 Distressed Sales

32
2014 Distressed Sales

33
Where is our Shadow Inventory NOD = Notice of Default – Prospect for a short sale NOS = Notice of Sale – Going to Auction REO = Bank Owned – Sale at discretion of “Asset Managers”

34
383 Bank Owned Properties Not Currently For Sale Greater Reno/Sparks Data is from RealtyTrac January 2015

35
577 Pre-Foreclosure Properties Not Currently For Sale Greater Reno/Sparks Data is from RealtyTrac January 2015

36
150 Properties Going to Auction Not Currently For Sale Greater Reno/Sparks Data is from RealtyTrac January 2015

37
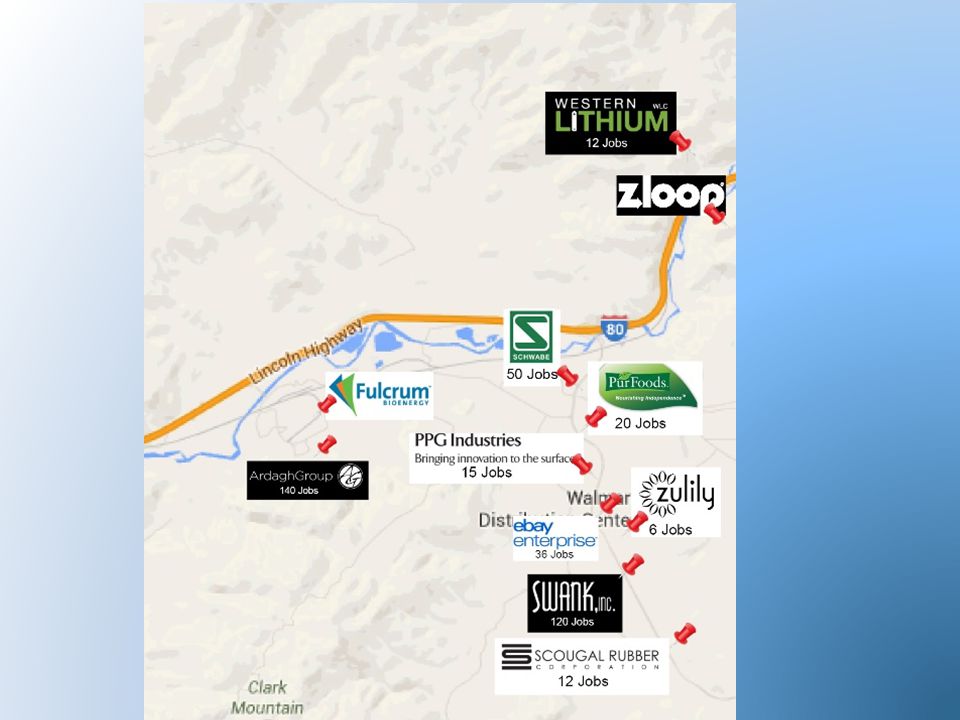
New Jobs Are On Coming!

38
Jobs are coming to our area EDAWN brings over 2000 jobs in 2014 Tesla will bring 6500 primary jobs – And up to 10,000 secondary jobs Defeat of Margin Tax removes stumbling block Unemployment falls to close to 6% Nevada Governor’s Economic Development – GOED is bringing more jobs to our area

39
NV Jobs in Tourism & Gaming Data from GOED

40
NV Jobs in Aerospace & Defense Data from GOED

41
Nevada Jobs in Energy Data from GOED

42
NV Jobs in Information Technology Data from GOED

43
NV Jobs in Logistics & Operations Data from GOED

44
NV Jobs in Manufacturing Data from GOED

49
It pays to be different In the past we have evaluated affordability for the entire region. Home owners with different incomes are attracted to different areas. Here are some areas selected for continued population growth.

50
Affordable House Defined Used the median income for each Zip Code Used PITI and 28% Mortgage Debt to Gross Income Interest was increased by 1% for end of 2015 The Washoe medium income in 2014 was $53,994.

51
Population 25,400 25,700 Homes Sales in 2014 = 370 Est. Shadow Inventory = 198

52
89434 Sparks East and Foothills 2014 2015est. Median Home Value$199,000 $208,600 Median Household Income$55,788 Affordable House Value$267,668 $238,309 January 2015 Inventory30 Homes below $267,66811 Homes below $259,000*9 *Washoe County Affordable Home

53
Population 37,400 39,500 Homes Sales in 2014 = 886 Est. Shadow Inventory = 70

54
89436 Sparks Suburban & Spanish Springs 2014 2015est. Median Home Value $260,000 $270,000 Median Household Income $79,216 Affordable House Value $380,074 $338,309 January 2015 Inventory104 Homes below $380,074 87 Homes below $259,000*22 *Washoe County Affordable Home

55
Population 42,400 43,800 Homes Sales in 2014 = 652 Est. Shadow Inventory = 10

56
89506 Reno North Valleys & Stead 2014 2015est. Median Home Value $172,000 $181,400 Median Household Income $57,496 Affordable House Value $275,862 $245,605 January 2015 Inventory43 Homes below $275,862 29 Homes below $259,000*27 *Washoe County Affordable Home

57
Population 25,900 26,400 Homes Sales in 2014 = 434 Est. Shadow Inventory = 9

58
89511 Old Southwest Suburban 2014 2015est. Median Home Value $475,000 $489,100 Median Household Income $92,166 Affordable House Value $442,207 $393,705 January 2015 Inventory153 Homes below $442,207 11 Homes below $259,000*2 *Washoe County Affordable Home

59
Population 24,400 26,200 Homes Sales in 2014 = 620 Est. Shadow Inventory = 21

60
89521 Reno South Meadows 2014 2015est. Median Home Value $286,000 $294,000 Median Household Income $72,900 Affordable House Value $349,770 $311,406 January 2015 Inventory93 Homes below $349,770 49 Homes below $259,000*10 *Washoe County Affordable Home

61
Population 33,400 34,300 Homes Sales in 2014 = 545 Est. Shadow Inventory = 24

62
89523 Reno Northwest Suburban 2014 2015est. Median Home Value$280,000 $289,500 Median Household Income $67,952 Affordable House Value $326,030 $290,270 January 2015 Inventory90 Homes below $326,030 14 Homes below $259,000*8 *Washoe County Affordable Home

63
Population 19,011 20,200 Homes Sales in 2014 = 457 Est. Shadow Inventory = 79

64
89408 Fernley 2014 2015est. Median Home Value $144,000 $150,000 Median Household Income $50,213 Affordable House Value $240,919 $214,494 January 2015 Inventory63 Homes below $240,919 49 Homes below $259,000*53 *Washoe County Affordable Home

65
The Take Away for 2015 Median prices increase 5-6% in 2015 Interest rates historically low until midyear – Should start rising to about 5% by years end Jobs opportunities will continue to grow Distressed sales will continue to fall off Affordability will continue to decline

66
Thank You Reno/Sparks Association of REALTORS® 5650 Riggins Court, Reno, NV 775-823-8800 www.rsar.net

Similar presentations