Download presentation
Presentation is loading. Please wait.

1
David Masson Shane Rawlings Mark Shtayerman

2
Sugar is the an agricultural commodity derived from sugar cane and sugar beet that is used in –Food industry as a sweetener and preservative –Industrial uses include in Bio-fuels Green Bio-plastics Cosmetics Explosives Traded on New York Inter Continental Exchange (ICE) but can also be traded through ETFS: SGG with $28M cap, CANE, SGAR Trough of some importance is happening now as of 5/16/13 as sugar sold-off to 16.82 in the intraday
 but can also be traded through ETFS: SGG with $28M cap, CANE, SGAR Trough of some importance is happening now as of 5/16/13 as sugar sold-off to in the intraday")
3
Data used for this analysis was obtained from Nick Laird –1966 to present Long Term Cycles –14-19 year cycle – only two observed so we will need to see more cycles –7 year cycle with an orb of 1 year – all observed were combination cycles Intermediate Cycles –38 month cycle with an orb of 7 months –27 month cycle with an orb of 8 months –39 week cycle with an orb of 10 weeks Short Term Cycles –Primary is 18 weeks with an orb of 10 weeks –Half is 8 weeks with an orb of 3 weeks –Major is 7 weeks with an orb of 2 weeks

4
Two longest cycles observed were 18.5 and 14 years long. The cycle troughs happened in –12/66 at 1.28 ¢/lb. –6/85 at 2.78 ¢/lb. –4/99 at 4.21 ¢/lb. We don’t have enough data to conclude which cycle is normal length and which one has distorted We are expecting a trough any time for 7 year cycle in 2014 with an orb of a year. The trough for this cycle can be a also a trough for a longer cycle too, which will make it a 14 year longer term cycle. If not, then sugar probably has an 18-22 year cycle.

5
We have observed 6 full cycles and the seventh is about to be completed, all ranging from 5.6 to 8.2 years. Removing shortest and longest results in a cycle 6.9 year long with an orb of 1 year. Considering all data price gain is 112-1164% with the price loss of 49-94% See Appendix A for graphical data plots * May 2013 is a notional date for end of cycle 7

6
7 year cycle subdivides into two 38 month cycles We have observed 13 full cycles and the 14 th is about to be completed, all ranging from 32 to 58 months. –Considering all data the Mean cycle is 45 months with orb of 13 months –Removing two longest cycles with lengths of 50 and 58 months –The observed cycle is 38 months with an orb of 7 months with 79% probability Considering all data price gain is 25-1164% with the price loss of 31-83% Reducing probability to 79% the –Expected price gain is 82-638% –Expected price loss is 34-75% Table is on the next slide See Appendix B for graphical data plots * May 2013 is a notional date for end of cycle 14

7
See Appendix B for graphical data plots * May 2013 is a notional date for end of cycle 14

8
7 year cycle subdivides into three 27 month cycles We have observed 20 full cycles and the 21 th is about to be completed, all ranging from 13 to 39 months. –Considering all data the Mean cycle is 26 months with orb of 13 months –Removing four outlier cycles with lengths of 13, 16, 38 and 39 months –The observed cycle is 27 months with an orb of 8 months with 80% probability Considering all data price gain is 23-356% with the price loss of 20- 88% Reducing probability to 80% the –Expected price gain is 49-338% –Expected price loss is 29-79% Table is on the next slide

9
See Appendix B for graphical data plots

10
38 month cycle subdivides into four 39 week cycles 27 month cycle subdivides into three 39 week cycles We have observed 60 full cycles and the 61 th is about to be completed, all ranging from 17 to 65 weeks. Considering all data the Mean cycle is 41 weeks with orb of 24 weeks Removing 8 outlier cycles with lengths of less than 23 weeks and greater than 55 weeks results in a cycle of 40 weeks with an orb of 14 weeks with 87% probability Removing 18 outlier cycles with lengths of less than 27 weeks and greater than 51 weeks results in a cycle of 39 weeks with an orb of 10 weeks with 70% probability Considering all data price gain is 13-338% with the price loss of 6-76% Reducing price probability to 80% the –Expected price gain is 23-150% –Expected price loss is 16-76% See Appendix C for tabular data

11
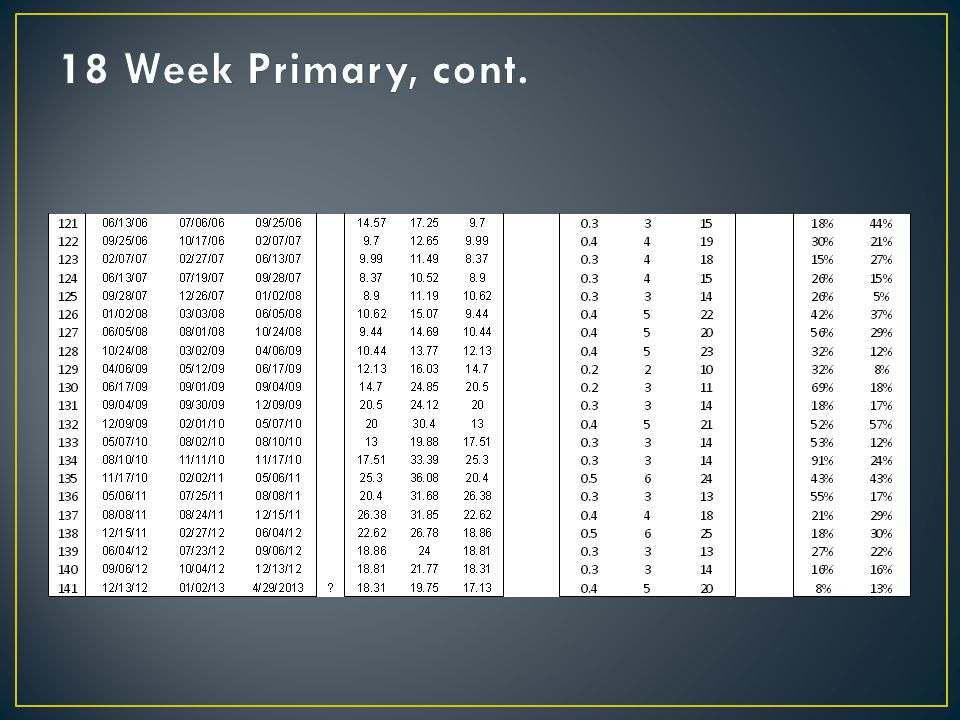
39 week cycle subdivides into two or three 18 week primary cycles We have observed 141 cycles with last one possibly ending on 4/29/13, all ranging from 9 to 28 weeks. Considering all data the Mean cycle is 19 weeks with orb of 10 weeks Removing 20% outlier cycles with lengths of less than 11 weeks and greater than 25 weeks results in a cycle of 18 weeks and an orb of 6 weeks with an 80% probability Considering all data price gain is 8-160% with the price loss of 4- 57% Reducing price probability to 80% the –Expected price gain is 13-89% –Expected price loss is 10-42% See Appendix D for tabular data

12
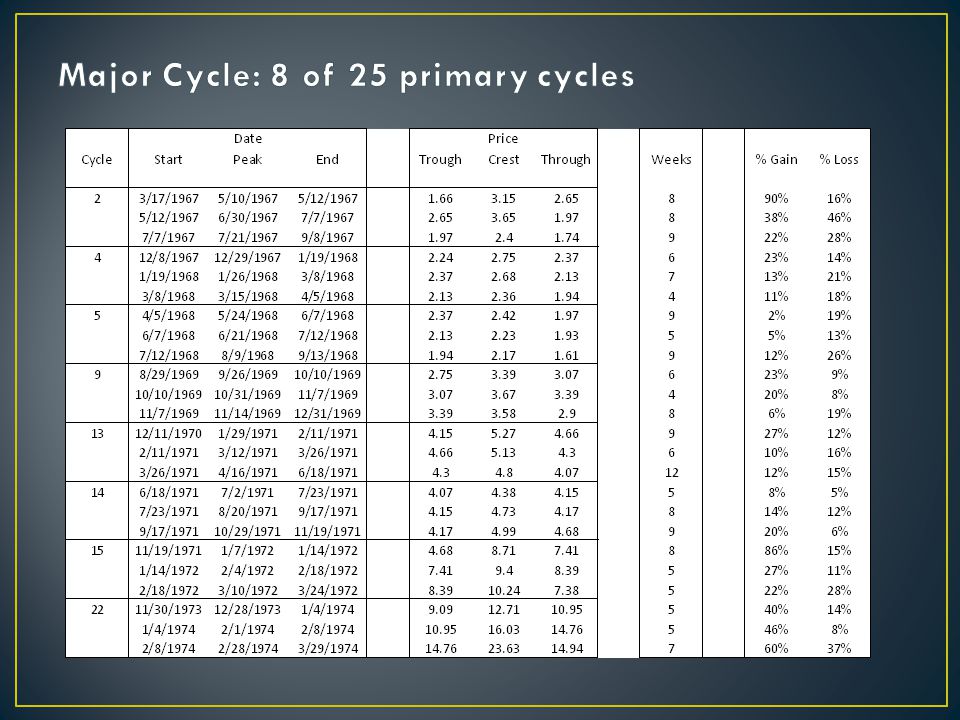
25 of the 141 primary cycles were evaluated. Based on that data primary cycle subdivides into –Two-phase half-primary cycles 64% of the time (16 of 25 primary cycles evaluated) –Three phase major cycles 32% of the time (8 of 25 primary cycles evaluated) –No discernible division 4% of the time (1 of 25 primary cycles evaluated) Evaluating half-primary cycle –Considering all of the data the cycle is 7 weeks with an orb of 4 weeks –Reducing 3 outliers results in a cycle of 8 weeks and orb of 3 (with 91% probability) –Expected price gain is 11-58% and expected loss is 8-23% (with 80% probability) Evaluating major cycle –Considering all of the data the cycle is 8 weeks with an orb of 4 weeks –Reducing 3 outliers results in a cycle of 7 weeks and orb of 2 (with 88% probability) –Expected price gain is 8-60% and expected loss is 8-28% (with 80% probability) There is a possibility that the primary cycle sub-divides into two or three 7 week sub-cycles See Appendix E for tabular data
 –Three phase major cycles 32% of the time (8 of 25 primary cycles evaluated) –No discernible division 4% of the time (1 of 25 primary cycles evaluated) Evaluating half-primary cycle –Considering all of the data the cycle is 7 weeks with an orb of 4 weeks –Reducing 3 outliers results in a cycle of 8 weeks and orb of 3 (with 91% probability) –Expected price gain is 11-58% and expected loss is 8-23% (with 80% probability) Evaluating major cycle –Considering all of the data the cycle is 8 weeks with an orb of 4 weeks –Reducing 3 outliers results in a cycle of 7 weeks and orb of 2 (with 88% probability) –Expected price gain is 8-60% and expected loss is 8-28% (with 80% probability) There is a possibility that the primary cycle sub-divides into two or three 7 week sub-cycles See Appendix E for tabular data.")
13
On 5/16/13 the sugar hit a new low at 16.82 ¢/lb. possibly –Ending the primary cycle at 20 weeks long (normal range) –Possibly the 39 week cycle at 47 weeks long (getting close to expanded cycle above 49 weeks) –Possibly the 27 months cycle at 23 months (within range) –Possibly the 38 month cycle at 36 months (right on the mark) –Possibly the 7 year cycle at 5.8 years (a bit shorter) –Small possibility that the 14 year cycle is also unfolding here too (not preferred outlook)
 –Possibly the 39 week cycle at 47 weeks long (getting close to expanded cycle above 49 weeks) –Possibly the 27 months cycle at 23 months (within range) –Possibly the 38 month cycle at 36 months (right on the mark) –Possibly the 7 year cycle at 5.8 years (a bit shorter) –Small possibility that the 14 year cycle is also unfolding here too (not preferred outlook).")
14
Preferred outlook: 7 year cycle has started last month with the price expected appreciation between 113 to 1164% depending on harvest and geopolitical situations –Minimal price would be to produce a double top to the highs of 36.08 ¢/lb. in Feb 2011, but it can go higher 27 and 38 month cycles probably started with price objectives based on the mean price gain for each of the respective cycles –38 month cycle crest mean price expectation is 78.66 ¢/lb. –27 month cycle crest mean price expectation is 50.28 ¢/lb. 39 week cycle probably started with the price objective of 31.95 ¢/lb. This preferred outlook will become more probable as sugar will break above the 19.75 ¢/lb. high of the previous primary cycle If May was not the multi year low, then we are expecting the multi year low commence within by June 2015

15
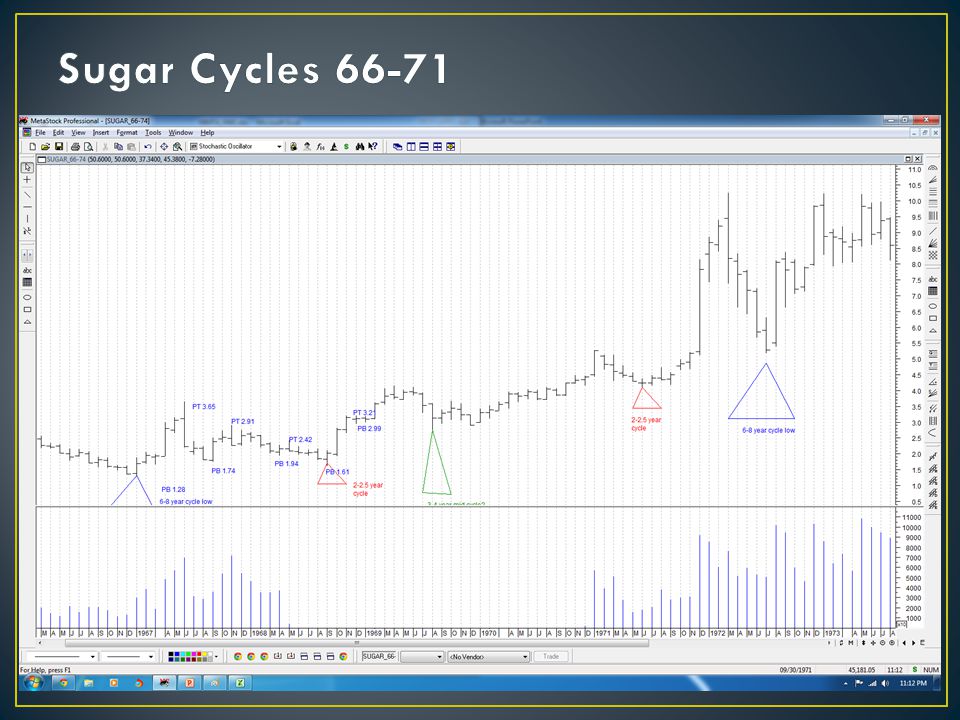
Sugar Long Term Cycles

17
Sugar Intermediate Term Cycles

22
9 Month Cycle

25
18 Week Primary Cycle

31
Half and Major Cycles

Similar presentations