Download presentation
Presentation is loading. Please wait.

1
Water Quality; Environmental Assessment; Ecological Processes Greg Jennings, PhD, PE Professor & Extension Specialist Biological & Agricultural Engineering North Carolina State University jennings@ncsu.edu References: 1.EPA Watershed Academy Web: http://cfpub.epa.gov/watertrain/index.cfm http://cfpub.epa.gov/watertrain/index.cfm 2.A.Ward and S.W.Trimble, ENVIRONMENTAL HYDROLOGY, CRC- Lewis Press Boca Raton,Fl, 475pp, 2004

2
EPA Watershed Academy Web: http://cfpub.epa.gov/watertrain/index.cfm http://cfpub.epa.gov/watertrain/index.cfm

3
EPA Watershed Academy Web: http://cfpub.epa.gov/watertrain/index.cfm http://cfpub.epa.gov/watertrain/index.cfm Need to Know: 1.Watershed Principles, Processes, Functions 2.Ecosystem Services of Natural Ecosystems: a.Air and water quality b.Mitigation of droughts and floods c.Soil generation and fertility d.Waste decomposition e.Nutrient cycling f.Biodiversity g.Many others 3.Watershed Ecology a.Physical and biological settings b.Natural systems concept c.Structure and functions

4
EPA Watershed Academy Web: http://cfpub.epa.gov/watertrain/index.cfm http://cfpub.epa.gov/watertrain/index.cfm Need to Know: 1.Flowing (lotic) Systems (e.g. streams, rivers) 2.Still (lentic) Systems (e.g. lakes, ponds) 3.Watershed Functions: a.Transport and storage of water & sediment b.Cycling and transformation of carbon, nutrients c.Ecological succession 3.Stream Corridor Structure (channel, floodplain, upland fringe) a.Lane’s channel equilibrium:
 2.Still (lentic) Systems (e.g. lakes, ponds) 3.Watershed Functions: a.Transport and storage of water & sediment b.Cycling and transformation of carbon, nutrients c.Ecological succession 3.Stream Corridor Structure (channel, floodplain, upland fringe) a.Lane’s channel equilibrium:.")
5
EPA Watershed Academy Web: http://cfpub.epa.gov/watertrain/index.cfm http://cfpub.epa.gov/watertrain/index.cfm Need to Know: 1.Stream Flow: base flow, storm flow

6
EPA Watershed Academy Web: http://cfpub.epa.gov/watertrain/index.cfm http://cfpub.epa.gov/watertrain/index.cfm Need to Know: 1.Stream Discharge (Continuity Equation): Q = V A
: Q = V A")
7
EPA Watershed Academy Web: http://cfpub.epa.gov/watertrain/index.cfm http://cfpub.epa.gov/watertrain/index.cfm Need to Know: 1.Bankfull Discharge: fills channel and begins to spread onto floodplain

8
EPA Watershed Academy Web: http://cfpub.epa.gov/watertrain/index.cfm http://cfpub.epa.gov/watertrain/index.cfm Need to Know: 1.Landforms and Deposits: Meander scroll, a sediment formation marking former channel locations. Chute, a new channel formed across the base of a meander. As it grows in size, it carries more of the flow. Oxbow, a term used to describe the severed meander after a chute is formed. Clay plug, a soil deposit developed at the intersection of the oxbow and the new main channel. Oxbow lake, a body of water created after clay plugs the oxbow from the main channel. Natural levees, formations built up along the bank of some, generally low-gradient streams that flood. As sediment-laden water spills over the bank, the sudden loss of depth and velocity causes coarser-sized sediment to drop out of suspension and collect along the edge of the stream. Splays, delta-shaped deposits of coarser sediments that occur when a natural levee is breached. Natural levees and splays can prevent floodwaters from returning to the channel when floodwaters recede. Backswamps, a term used to describe floodplain wetlands formed by natural levees.

9
EPA Watershed Academy Web: http://cfpub.epa.gov/watertrain/index.cfm http://cfpub.epa.gov/watertrain/index.cfm Need to Know: 1.River Continuum Concept:

10
EPA Watershed Academy Web: http://cfpub.epa.gov/watertrain/index.cfm http://cfpub.epa.gov/watertrain/index.cfm Need to Know: 1.Watershed Change & Ecological Impacts: Natural vs. Human 2.Nutrient Pollution (Nitrogen & Phosphorus)
.")
11
EPA Watershed Academy Web: http://cfpub.epa.gov/watertrain/index.cfm http://cfpub.epa.gov/watertrain/index.cfm Need to Know: 1.Watershed Protection Tools: Tool 1. Land Use Planning Tool 2. Land Conservation Tool 3. Aquatic Buffers Tool 4. Better Site Design Tool 5. Erosion and Sediment Control Tool 6. Stormwater Best Management PracticesStormwater Best Management Practices Tool 7. Non-Stormwater Discharges Tool 8. Watershed Stewardship Programs

12
EPA Watershed Academy Web: http://cfpub.epa.gov/watertrain/index.cfm http://cfpub.epa.gov/watertrain/index.cfm Need to Know: 1.Agricultural Management Practices for Water Quality: Conservation Tillage - leaving crop residue (plant materials from past harvests) on the soil surface reduces runoff and soil erosion, conserves soil moisture, helps keep nutrients and pesticides on the field, and improves soil, water, and air quality; Crop Nutrient Management - fully managing and accounting for all nutrient inputs helps ensure nutrients are available to meet crop needs while reducing nutrient movements off fields. It also helps prevent excessive buildup in soils and helps protect air quality; Pest Management - varied methods for keeping insects, weeds, disease, and other pests below economically harmful levels while protecting soil, water, and air quality; Conservation Buffers - from simple grassed waterways to riparian areas, buffers provide an additional barrier of protection by capturing potential pollutants that might otherwise move into surface waters.

13
EPA Watershed Academy Web: http://cfpub.epa.gov/watertrain/index.cfm http://cfpub.epa.gov/watertrain/index.cfm Need to Know: 1.Agricultural Management Practices for Water Quality: Irrigation Water Management - reducing nonpoint source pollution of ground and surface waters caused by irrigation systems; Grazing Management - minimizing the water quality impacts of grazing and browsing activities on pasture and range lands; Animal Feeding Operations (AFOs) Management - minimizing impacts of animal feeding operations and waste discharges through runoff controls, waste storage, waste utilization, and nutrient management; Erosion and Sediment Control - conserving soil and reducing the mass of sediment reaching a water body, protecting both agricultural land and water quality and habitat.
 Management - minimizing impacts of animal feeding operations and waste discharges through runoff controls, waste storage, waste utilization, and nutrient management; Erosion and Sediment Control - conserving soil and reducing the mass of sediment reaching a water body, protecting both agricultural land and water quality and habitat.")
14
Sediment Natural erosion: –Also referred to as geologic erosion -- is relatively slow –Most rapid along shorelines and stream channel –Vital factor in maintaining environmental balance –Produces about 30% of all sediment in U.S. Accelerated erosion: –Refers to erosion occurring at increased rate usually because of removal of natural vegetation or alteration of ground contour –Accounts for 70% of all sediment generated in U.S. –Construction and agriculture are main causes

15
Screens out sunlight/ reduces clarity Fills channels and reduces capacity sediments can fill up ponds and reservoirs sedimentation can plug culverts and storm drains Pollutants attach to sediment particles –legal action –additional costs and penalties –delays in schedule Property damage from flooding Impacts of Sediment

16
TSS: Concentration of sediment in water measured in mass per unit volume (mg/L) TSS Load: Product of concentration and stream discharge (tons per day) TSS can be related to Turbidity for each watershed Total Suspended Sediment - TSS
 TSS Load: Product of concentration and stream discharge (tons per day) TSS can be related to Turbidity for each watershed Total Suspended Sediment - TSS")
17
Example Problem In the Wages Creek watershed, a 2-L sample of water was collected from a stream with a discharge of 10 cfs. The dry weight of sediment in the sample was 48 mg. Calculate TSS concentration and TSS load.

18
Example Problem In the Wages Creek watershed, a 2-L sample of water was collected from a stream with a discharge of 10 cfs. The dry weight of sediment in the sample was 48 mg. Calculate TSS concentration and TSS load. Given: Volume = 2 L; Mass = 48 mg; Discharge = 10 cfs Calculate: TSS = 48 mg / 2 L = 24 mg/L TSS load = 24 mg/L X 10 cfs = 0.65 tons/day

19
An expression of the optical property that causes light to be scattered and absorbed rather than transmitted in straight lines through the water (the measure of relative clarity) measured in NTUs: Nephelometric Turbidity Units Turbidity can be related to TSS Turbidity
 measured in NTUs: Nephelometric Turbidity Units Turbidity can be related to TSS Turbidity")
21
Example from Wages Creek

22
Relationship of Turbidity and TSS (must be determined for each watershed)
")
23
Relationship of TSS and Discharge (must be determined for each watershed)
")
24
Example Problem In the Wages Creek watershed, a 2-L sample of water was collected from a stream with a discharge of 10 cfs. The measured turbidity was 20 NTU. What is the expected TSS concentration? What is the expected TSS load? As the discharge increases to 50 cfs, how does TSS load change?

25
Example Problem In the Wages Creek watershed, a 2-L sample of water was collected from a stream with a discharge of 10 cfs. The measured turbidity was 20 NTU. What is the expected TSS concentration? What is the expected TSS load? As the discharge increases to 50 cfs, how does TSS load change? From the graphs, we expect the TSS concentration to range from 30 to 60 mg/L and the TSS load to range from 0.1 to 1.0 tons/day. At 50 cfs, the expected TSS load increases to 3 to 10 tons/day.

26
Nutrients Can lead to algal blooms in surface waters which then result in low DO and fish kills Can cause drinking water to be unsafe (nitrate) Freshwater – usually P limited Estuarine – usually N limited
 Freshwater – usually P limited Estuarine – usually N limited")
27
Nitrogen Nitrogen Forms : Nitrate, Ammonium, Organic N Total N = TKN + NO 3 -N + NO 2 -N TKN = Organic N + Ammonium-N –Indicator of animal or human waste Nitrate: soluble in water –Unpolluted water <1 mg/L of NO 3 -N –Drinking water standard 10 mg/L of NO 3 -N

28
Ammonia Concentrations and Fish Kills Lethal concentrations of ammonia range from 0.2 - 2.0 ppm –trout most sensitive –carp least sensitive

30
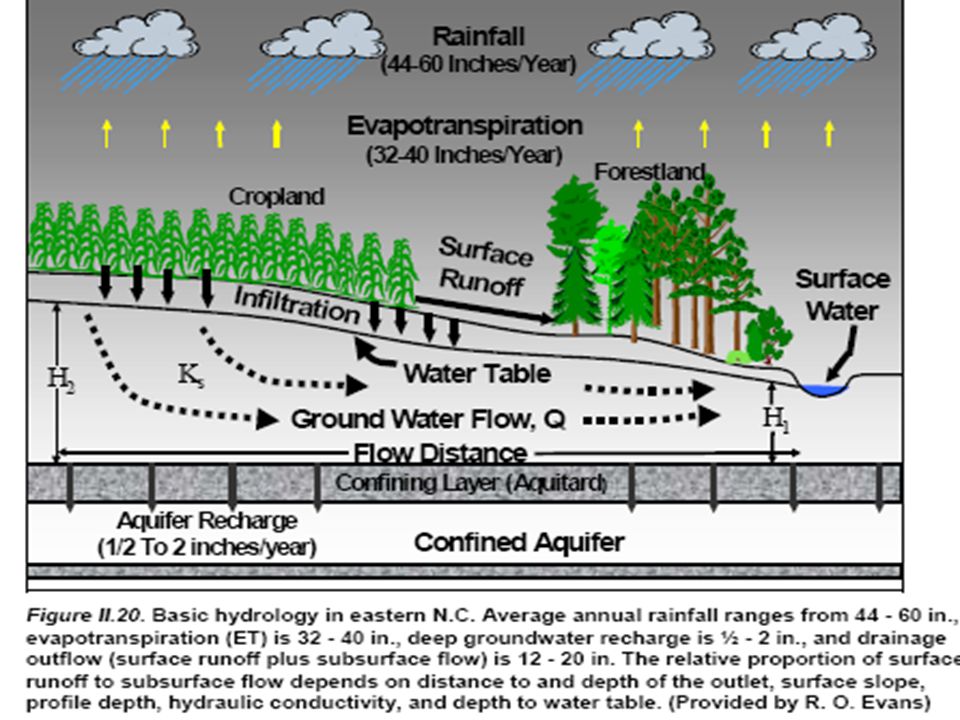
Aquitard Nitrate and water movement Nitrate and water movement Nitrate losses due to buffer

31
Source: Deanna Osmond, NCSU

32
Example Problem For a 1,000-hectare farm in the Neuse River Basin, it is determined that the total nitrogen loss to the river is 20 kg/ha/year. What is the change in nitrogen load if the farmers installs the following BMPs which? BMPhectares affected Vegetative Buffer > 30 ft100 Vegetative Buffer > 20 ft100 Tree/shrub Buffer > 20ft100 Water control structures200

33
Example Problem Solution: The current N load is 20,000 kg/year. The total load reduction is calculated in the table below as 5,200 kg/year, or 26%. BMPhectares % reductionload reduction Vegetative Buffer > 30 ft100651300 Vegetative Buffer > 20 ft10040800 Tree/shrub Buffer > 20ft100751500 Water control structures200401600 Total5005200

34
Constructed Wetlands Bioretention Areas

35
Source: Bill Hunt, NCSU Bioretention Areas

36
Example Problem What is the expected nutrient load reduction if a properly-designed bioretention area is installed to treat runoff from a 10-acre commercial development in central North Carolina where the current loading is estimated to be 20 lb/ac/year of nitrogen and 0.5 lb/ac/year of phosphorus?

37
Example Problem What is the expected nutrient load reduction if a properly-designed bioretention area is installed to treat runoff from a 10-acre commercial development in central North Carolina where the current loading is estimated to be 20 lb/ac/year of nitrogen and 0.5 lb/ac/year of phosphorus? Solution: Current loading is 200 lb/year of N and 5 lb/year of P. The expected removal efficiencies are at least 40% for N and at least 50% for P, resulting in reductions of at least 80 lb/year of N and 2.5 lb/year of P.

38
Buffer Width Affects Runoff of P

39
Example Problem For inorganic fertilizer applied to farmland in North Carolina, the expected runoff loss to receiving waters is 0.45 lb/ac/year. What buffer width is needed to reduce this loss to 0.15 lb/ac/year?

40
Example Problem For inorganic fertilizer applied to farmland in North Carolina, the expected runoff loss to receiving waters is 0.45 lb/ac/year. What buffer width is needed to reduce this loss to 0.15 lb/ac/year? Solution: The buffer will reduce runoff losses depending on width. To reduce the runoff loss from 0.45 to 0.15, a delivery ratio of 0.33 is required. The minimum buffer width required is 25 ft.

Similar presentations


>")

