Download presentation
Presentation is loading. Please wait.

1
Bayesian Hierarchical Models for Detecting Safety Signals in Clinical Trials H. Amy Xia and Haijun Ma Amgen, Inc. MBSW 2009, Muncie, IN March 20, 2009 Disclaimer: The views expressed in this presentation represent personal views and do not necessarily represent the views or practices of Amgen.

2
Outline Introduction A motivating example Bayesian Hierarchical Models –Meta analysis of Adverse Events data from multiple studies incorporating MedDRA structure –Incorporate patient level data –Effective graphics Closing Remarks

3
Three-Tier System for Analyzing Adverse Events in Clinical Trials Tier 1: Pre-specified Detailed Analysis and Hypothesis Testing –Tier 1 AEs are events for which a hypothesis has been defined Tier 2: Signal Detection among Common Events –Tier 2 AEs are those that are not pre-specified and “common” Tier 3: Descriptive Analysis of Infrequent AEs –Tier 3 AEs are those that are not pre-specified and infrequent Gould 2002 & Mehrotra 2004 SPERT White Paper 2008

4
Multiplicity Issue in Detecting Signals Is Challenging Detection of safety signals from routinely collected, not pre-specified AE data in clinical trials is a critical task in drug development Multiplicity issue in such a setting is a challenging statistical problem –Without multiplicity considerations, there is a potential for an excess of false positive signals –Traditional ways of adjusting for multiplicity such as Bonferroni may lead to an excessive rate of false negatives –The challenge is to develop a procedure for flagging safety signals which provides a proper balance between ‘no adjustment’ versus ‘too much adjustment’

5
Considerations Regarding Whether Flagging an Event Actual significance levels Total number of types of AEs Rates for those AEs not considered for flagging Biologic relationships among various AEs 1 st two are standard considerations in the frequentist approach. The 2 nd two are not, but relevant in the Bayesian approach -- Berry and Berry, 2004

6
Bayesian Work in Signal Detection Spontaneous adverse drug reaction reports –Gamma Poisson Shrinker (GPS) on FDA AERS database (DuMouchel,1999) –Bayesian Confidence Propagation Neural Network (BCPNN) on WHO database (Bate, et al. 1998) Clinical trial safety (AE) data –Bayesian hierarchical mixture modeling (Berry and Berry, 2004)
 Clinical trial safety (AE) data –Bayesian hierarchical mixture modeling (Berry and Berry, 2004).")
7
Meta Analysis Glass (1976) Meta-analysis refers to a statistical analysis that combines the results of some collection of related studies to arrive a single conclusion to the question at hand Meta-analysis based on –aggregate patient data (APD meta-analysis) –Individual patient data (IPD) meta-analysis Bayesian modeling is a natural choice to incorporate the complex hierarchical structure of the data
 Meta-analysis refers to a statistical analysis that combines the results of some collection of related studies to arrive a single conclusion to the question at hand Meta-analysis based on –aggregate patient data (APD meta-analysis) –Individual patient data (IPD) meta-analysis Bayesian modeling is a natural choice to incorporate the complex hierarchical structure of the data")
8
George Chi, H.M. James Hung, Robert O’Neill (FDA CDER) “Safety assessment is one area where frequentist strategies have been less applicable. Perhaps Bayesian approaches in this area have more promise.” (Pharmaceutical Report, 2002)
 Safety assessment is one area where frequentist strategies have been less applicable. Perhaps Bayesian approaches in this area have more promise. (Pharmaceutical Report, 2002).")
9
An Example Data from four double-blind placebo-controlled studies on drug X. Study populations are similar. Sample sizes: After converting all AEs into same MedDRA version, reported AEs are coded to 464 PTs under 23 SOCs and 233 HLTs StudyDrug X N Drug X Subj-yr Placebo N Placebo Subj-yr Study A5728.255519.02 Study B486104.7516634.93 Study C39085.4419340.97 Study D31268.7830665.91

10
N_0: sample size in placebo arm; N_1: sample size in treatment arm n_0: # subject with AE in placebo arm; n_1: # subject with AE in treatment arm rt_0: subject incidence in placebo arm; rt_1: subject incidence in treatment arm

11
Proposed Bayesian Approach Hierarchical mixture models for aggregated binary responses was constructed based on the work by Berry & Berry(2004) –Explore impact of using different MedDRA hierarchy –Inclusion of study effects –Further extended to a hierarchical Poisson mixture model, to account for different exposure/follow-up times between patients Individual patient level models are discussed Implemented the above models with available software –WinBUGS for model implementation –S-Plus graphics for inference
 –Explore impact of using different MedDRA hierarchy –Inclusion of study effects –Further extended to a hierarchical Poisson mixture model, to account for different exposure/follow-up times between patients Individual patient level models are discussed Implemented the above models with available software –WinBUGS for model implementation –S-Plus graphics for inference")
12
MedDRA MedDRA (the Medical Dictionary for Regulatory Activities Terminology) is a controlled vocabulary widely used as a medical coding scheme. MedDRA Definition (MSSO): –MedDRA is a clinically-validated international medical terminology used by regulatory authorities and the regulated biopharmaceutical industry. The terminology is used through the entire regulatory process, from pre-marketing to post-marketing, and for data entry, retrieval, evaluation, and presentation. https://eudract.emea.europa.eu/docs/medDRA/Introduction_To_MedDRA.ppt MSSO: Introduction to MedDRA
: –MedDRA is a clinically-validated international medical terminology used by regulatory authorities and the regulated biopharmaceutical industry. The terminology is used through the entire regulatory process, from pre-marketing to post-marketing, and for data entry, retrieval, evaluation, and presentation. MSSO: Introduction to MedDRA.")
13
http://www.fda.gov/cder/present/dia-699/dia628/index.htm MedDRA and Pharmacovigilance - The Way Forward, 7/8/99

14
http://www.fda.gov/cder/present/dia-699/dia628/index.htm MedDRA and Pharmacovigilance - The Way Forward, 7/8/99

15
SOC = Respiratory, thoracic and mediastinal disorders HLGT = Respiratory tract infections HLT =Viral upper respiratory tract infections HLT = Influenza viral infections HLGT = Viral infectious disorders SOC = Infections and infestations PT = Influenza Example of MedDRA Hierarchy https://eudract.emea.europa.eu/docs/medDRA/Introduction_To_MedDRA.ppt MSSO: Introduction to MedDRA

16
Hierarchical Structure of MedDRA Bayesian hierarchical models allow for explicitly modeling AEs with the existing coding structure –AEs in the same SOC more likely to be similar within than across SOCs. –Allow for this possibility, but does not impose it, depending on the actual data –SOC tends to be too broad. HLT is more closely related to medical concepts. In fact, clinical and safety people would (informally) consider the similarity of the AEs, say, within SOCs when they review AE tables –For example, if differences in several CV events were observed, then each would be more likely to be causal than if differences came from medically unrelated areas (eg, skin, neurological, thrombosis, cancer) Bayesian hierarchical modeling allows a scientific, explicit, and more formal way to take it into consideration
 consider the similarity of the AEs, say, within SOCs when they review AE tables –For example, if differences in several CV events were observed, then each would be more likely to be causal than if differences came from medically unrelated areas (eg, skin, neurological, thrombosis, cancer) Bayesian hierarchical modeling allows a scientific, explicit, and more formal way to take it into consideration.")
17
Notations Study i=1,…I, SOC b=1,…B and PT j=1,…k b Data: For AE ibj –Treatment group: Y ibj incident events observed in N it patients with T ibj subjects’ exposure –Control group: X ibj incident events observed in N ic patients with C ibj subjects’ exposure

18
Bayesian Meta Analysis Hierarchical Logistic Regression Common treatment effect for same PT across studies

19
Bayesian Meta Analysis Hierarchical Logistic Regression (Cont.) Treatment effect with additive study effects: A random treatment effect/multiplicative model:
 Treatment effect with additive study effects: A random treatment effect/multiplicative model:")
20
Bayesian Meta Analysis Hierarchical Logistic Regression (Cont.) Other priors –Stage 1 λ bj ~N(μ λb, σ 2 λb ); –Stage 2 μ λb ~N(μ λ0, σ 2 λ0 ); σ 2 λb ~IG(α λ, β λ ); μ θb ~N(μ θ0, σ 2 θ0 ); σ 2 θb ~IG(α θ, β θ ) - Stage 3 μ λ0 ~N(μ λ00, σ 2 λ00 ); σ 2 λ0 ~IG(α λ00, β λ00 ) μ θ0 ~N(μ θ00, σ 2 θ00 ); σ 2 θ0 ~IG(α θ00, β θ00 ) Hyperparameters μ λ00, σ 2 λ00, α λ00, β λ00, μ θ00, σ 2 θ00, α θ00, β θ00, α λ, β λ, α θ, β θ are fixed constants
 Other priors –Stage 1 λ bj ~N(μ λb, σ 2 λb ); –Stage 2 μ λb ~N(μ λ0, σ 2 λ0 ); σ 2 λb ~IG(α λ, β λ ); μ θb ~N(μ θ0, σ 2 θ0 ); σ 2 θb ~IG(α θ, β θ ) - Stage 3 μ λ0 ~N(μ λ00, σ 2 λ00 ); σ 2 λ0 ~IG(α λ00, β λ00 ) μ θ0 ~N(μ θ00, σ 2 θ00 ); σ 2 θ0 ~IG(α θ00, β θ00 ) Hyperparameters μ λ00, σ 2 λ00, α λ00, β λ00, μ θ00, σ 2 θ00, α θ00, β θ00, α λ, β λ, α θ, β θ are fixed constants")
21
Inference AE bj is flagged if –Pr( θ bj > d*| Data) > p, where θ bj is log-OR in Binomial models and log-RR in Poisson models. –d* and p are all prespecified constants. Graphs are useful tools in deciphering data and presenting results

22
Model Selection Deviance Information Criteria (DIC) was used to compare models with same data Limited sensitivity analyses were done to check the robustness of the models Different levels of MedDRA structures were used –SOC/PT, HLT/PT and SOC/HLT/PT Treatment effect with additive study effects model using SOC/PT structure was chosen
 was used to compare models with same data Limited sensitivity analyses were done to check the robustness of the models Different levels of MedDRA structures were used –SOC/PT, HLT/PT and SOC/HLT/PT Treatment effect with additive study effects model using SOC/PT structure was chosen")
23
Bayesian Meta Analysis Hierarchical Log-linear Regression Poisson models –Adjust for different exposures in treatment and control –Assume constant hazard over time –Unless AEs are fairly common or follow up of studies are quite unbalanced between treatment arms, usually are not very different from Binomial models Y ibj ~Pois(t ibj T ibj ); X bj ~Pois(c ibj C ibj ) where t ibj and c ibj are event rates, and T ibj and C ibj for AE ibj are total exposure times in the treatment and control groups, respectively log(c ibj )=λ ibj ; log(t ibj )=λ ibj + θ bj, Note that θ bj =log(RR bj )
; X bj ~Pois(c ibj C ibj ) where t ibj and c ibj are event rates, and T ibj and C ibj for AE ibj are total exposure times in the treatment and control groups, respectively log(c ibj )=λ ibj ; log(t ibj )=λ ibj + θ bj, Note that θ bj =log(RR bj )")
27
Inferences of Binomial Hierarchical Model with Mixture Prior

28
Bayesian Patient Level Models IPD models to include within patient correlation and patient level factors while incorporating MedDRA coding hierarchy Data from one study is used:618 subject, 207 unique AEs, N = 127926

29
Simulation Study Simulation scheme: –Randomly assign subjects to treatment or placebo to create a “null” scenario –Adverse events within subject remain unchanged to maintain the SOC/PT hierarchy –1000 simulated datasets Family-wise error rates (also FDR in this case) of Fisher’s exact text unadjusted for multiplicity and Poisson regression with mixture prior are compared Percentage of simulated datasets yielding Y=0, 1, 2 or ≥3 incorrectly flagged adverse events out of 464 PTs are also compared
 of Fisher’s exact text unadjusted for multiplicity and Poisson regression with mixture prior are compared Percentage of simulated datasets yielding Y=0, 1, 2 or ≥3 incorrectly flagged adverse events out of 464 PTs are also compared")
30
Distribution of Y (%) FWER/ FDR 12>=3 Non-adjusted 2- sided Fisher’s exact test 2-sided test, p-value <=0.0599.12.75.491 Non-adjusted 1- sided Fisher’s exact test p-value<=0.0590.122.726.940.5 Bayes Hierarchical Poisson Model * c=1, p=0.710.27.52.00.7 c=1, p=0.86.14.61.30.2 c=1, p=0.92.82.70.10.0 c=1.2, p=0.710.27.61.90.7 c=1.2, p=0.86.04.61.20.2 c=1.2, p=0.92.72.60.10.0 c=2, p=0.77.05.31.50.2 c=2, p=0.83.73.30.40.0 c=2, p=0.91.31.20.10.0 RR≠1, p=0.713.810.32.51.0 RR≠1, p=0.87.96.31.40.2 RR≠1, p=0.93.63.50.10.0 *
 FWER/ FDR 12>=3 Non-adjusted 2- sided Fisher’s exact test 2-sided test, p-value <= Non-adjusted 1- sided Fisher’s exact test p-value<= Bayes Hierarchical Poisson Model * c=1, p= c=1, p= c=1, p= c=1.2, p= c=1.2, p= c=1.2, p= c=2, p= c=2, p= c=2, p= RR≠1, p= RR≠1, p= RR≠1, p= *")
31
Simulation Study 464 independent tests with alpha=0.05 would yield in average about 23 signals and have FDR=1 if no multiplicity is adjusted for. Correlation of the AE data reduced the error rate in our simulation study But the FDR is still as high as 99.1%. For 91% cases there are at least 3 falsely identified signals. The FWERs/FDRs for all Bayes model results are much lower and acceptable.

32
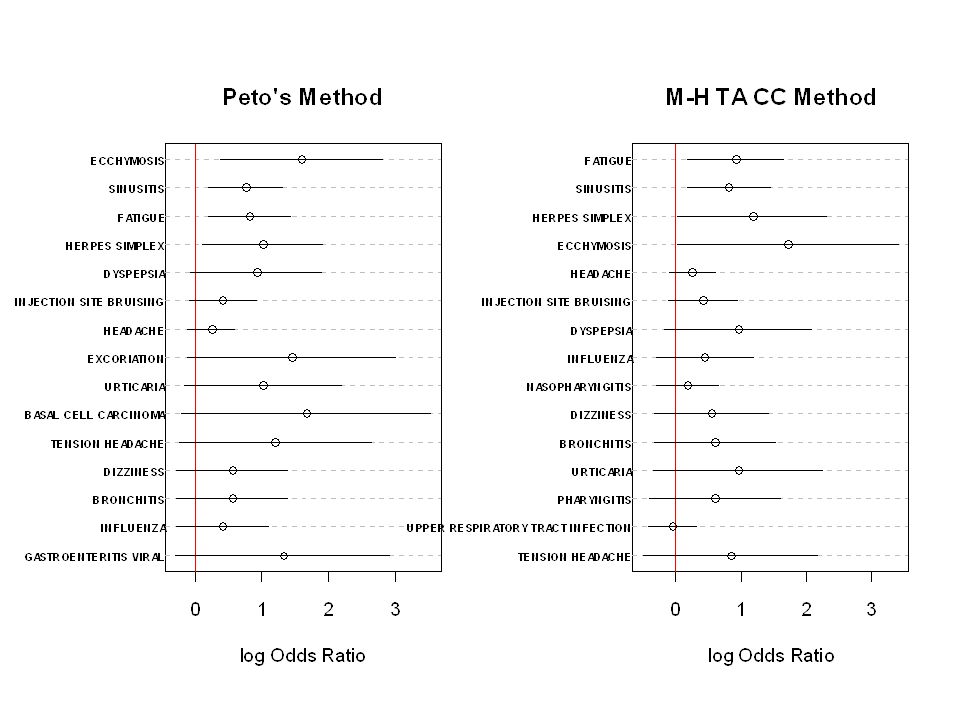
Closing Remarks Current traditional approach of flagging routinely collected AEs based on unadjusted p-values or CIs can result in excessive false positive signals –As a result, it can cause undue concern for approval/labeling/post marketing commitment Commonly used meta-analysis methods for aggregated binary outcome (OR) –Peto’s method is not recommended for severely unbalanced studies or common events unless treatment effects are small –MH method: needs continuity correction
 –Peto’s method is not recommended for severely unbalanced studies or common events unless treatment effects are small –MH method: needs continuity correction")
33
Closing Remarks (Cont.) Bayesian meta-analysis hierarchical mixture modeling provides a useful tool to analyze data from multiple studies and address multiplicity –Allows for explicitly modeling AEs with the existing MedDRA coding structure –Use a mixture prior by allowing a point mass on equality of the treatment and control rates –Study differences can be accounted for –No need to add continuity correction. Double zero studies are included. –For less common AEs and studies without a great amount of follow-up variation between treatment groups, inferences from Poisson regression and logistic regression models are very similar Computation for signal detection using IPD is challenging Graphics are effective in displaying flagged signals

34
Future Work More sensitivity analysis on the performance of the models Further simulation study on type II error and operating characteristics of Bayesian models Zero-inflated Poisson model might be a good approach for relatively healthy population Incorporating severity information of AEs Multi-axial structure of MedDRA coding system The field of clinical trial signal detection is still in its infancy –More research and practice are needed –Statisticians need to work with clinicians/safety scientists closely to further advance this field

35
References Bate A, Lindquist M, Edwards, IR, Olsson S, Orre R, Lansner A, and De Freitas RM (1998). A Bayesian neural network method for adverse drug reaction signal detection. Eur J Clin Pharmacol 54:315-321 Berry S and Berry D (2004) Accounting for multiplicities in assessing drug safety: a three-level hierarchical mixture model. Biometrics, 60: 418-426 Chi G, Hung HMJ, and O’Neill R (2002). Some comments on “Adaptive Trials and Bayesian Statistics in Drug Development” by Don Berry. In Pharmaceutical Report, Vol 9, 1-11 Crowe B, Xia A, Watson D, Shi H, Lin S, Kuebler J, Berlin J, et al. (2008). Recommendations for Safety Planning, Data Collection, Evaluation and Reporting During Drug, Biologic and Vaccine Development: A Report of the PhRMA Safety Planning, Evaluation and Reporting Team (SPERT). Manuscript in preparation. DuMouchel W (1999). Bayesian data mining in large frequency tables, with an application to the FDA Spontaneous Reporting System (with discussion). The American Statistician 53:177-202 Gould AL. Drug safety evaluation in and after clinical trials. Deming Conference, Atlantic City, 3 December 2002 Mehrotra, DV and Heyse, JF (2004). Multiplicity considerations in clinical safety analysis. Statistical Methods in Medical Research 13, 227-238 Spiegelhalter DJ, Best NG, Carlin BP and van der Linde A (2002) Bayesian measures of model complexity and fit (with discussion). J. Roy. Statist. Soc. B. 64, 583-640.
 Accounting for multiplicities in assessing drug safety: a three-level hierarchical mixture model. Biometrics, 60: Chi G, Hung HMJ, and O’Neill R (2002). Some comments on Adaptive Trials and Bayesian Statistics in Drug Development by Don Berry. In Pharmaceutical Report, Vol 9, 1-11 Crowe B, Xia A, Watson D, Shi H, Lin S, Kuebler J, Berlin J, et al. (2008). Recommendations for Safety Planning, Data Collection, Evaluation and Reporting During Drug, Biologic and Vaccine Development: A Report of the PhRMA Safety Planning, Evaluation and Reporting Team (SPERT). Manuscript in preparation. DuMouchel W (1999). Bayesian data mining in large frequency tables, with an application to the FDA Spontaneous Reporting System (with discussion). The American Statistician 53: Gould AL. Drug safety evaluation in and after clinical trials. Deming Conference, Atlantic City, 3 December 2002 Mehrotra, DV and Heyse, JF (2004). Multiplicity considerations in clinical safety analysis. Statistical Methods in Medical Research 13, Spiegelhalter DJ, Best NG, Carlin BP and van der Linde A (2002) Bayesian measures of model complexity and fit (with discussion). J. Roy. Statist. Soc. B. 64,")
36
Thank You!

37
Back-up Slides

39
Bayesian Hierarchical Model for AE (Berry & Berry 2004) PT level assumptions: SOC level assumptions: Global assumptions:
 PT level assumptions: SOC level assumptions: Global assumptions:")
40
SOC: Injury, Poisoning and Procedural Complications

Similar presentations


 Randomization:>")

>")

 v.4: Updating a Cancer Research Standard Ann Setser 1, Ranjana Srivastava 2, Lawrence Wright 1,>")


 How.>")
 Li and Devan.>")

 www.ahrq.gov.>")


 Hajime Uno (Kitasato University) Tianxi Cai, Els Goetghebeur,>")


 Score Statistics.>")