Download presentation
Presentation is loading. Please wait.

1
Stability Analysis of Acid Mined Caverns in Limestone for Natural Gas Storage (Bray et al., 2002)
")
2
Overview Background –Natural Gas Use and storage methods –Objective Modeling Methods –FLAC Code –Parameters simulated Modeling Results –Ideal cavern geometry –Parameter variations Conceptual model

3
Natural Gas Use by Sector (AGA, 2005) Natural Gas Primarily Composed of Methane 23% of U.S. Energy Use Used by 60% of Households in U.S. Consumption Varies: There is a Seasonal Increase of Almost 50% During the Winter Storage Allows for Continuous Service During High Demand

4
Underground Natural Gas Storage Depleted Reservoirs + Existing infrastructure - Location - 50% Cushion Gas Aquifers + Location - Up to 80% Cushion Gas - Highest Cost Salt Caverns + High injection and withdraw + Low Volume Cushion Gas - Limited Locations

5
Gas-Storage Caverns Created by Acid Dissolution Process Based on Solution Mined Salt Caverns Advantages + Carbonate Formations are Common Suitable Formations in Appalachian Basin Identified + Low Cushion Gas + Economically Competitive With Other Methods (Castle et al., 2004)
")
6
Salt Cavern Development by Water Injection (Barron, 1994)
")
7
Project Concept Creation of 0.5 to 1.0 BCF Natural Gas storage caverns in carbonates by dissolution with Hydrochloric Acid. Approximately same volume as Brackett Hall Optimal depth range: 1220-2740 m (4000-9000 ft)
.")
8
Objectives Will the proposed gas storage facility be mechanically stable? What is the optimal cavern shape? How do parameters such as in-situ stress, cavern geometry and internal cavern pressure effect cavern stability?

9
Basic Shapes Simulated *Not to scale*

10
Basic Shapes Simulated 40x12 m Spherical: r = 24.6 m ‘Tunnel’ r = 10 m 200 m 10 m 10x200 m 20 m 50 m 20x50 m Conical: r = 25 m h = 96 m *Not to scale*

11
200 m50 m12 mCavern Height 10 m20 m40 mCavern Radius 1.2 σ v 0.8 σ v 0.4 σ v Horizontal Stress 2440 m1830 m1220 mCenter Cavern Depth 125140 m 3 62570 m 3 31285 m 3 Cavern volume 1.0 BCF0.5 BCF0.25 BCFGas Volume (STP) HighBaselineLow Simulation Approach
 HighBaselineLow Simulation Approach")
12
M = Mass V = Volume ρ avg = average gas density at depth A = cross sectional area = d = 0 at top of cavity and increases downward Mass of Gas Stored in Cavity d r

15
Stability Simulations Run With FLAC 5.0 Fast Lagrangian Analysis of Continua –Itasca Consulting Group, Inc. Minneapolis, MN 2-D explicit finite-difference code for geomechanics Commonly used in: Mining Engineering Civil Engineering

16
20 x 50 m Cylindrical Cavern Grid

17
Simulation Approach Develop mesh set up for each shape Start at hydrostatic and increment P up then down Evaluate stability at each pressure Evaluate stresses and displacements at pressures of interest

18
Plasticity Indicators ○ At Yield in Tension * At Yield in Shear - Stresses have reached the tensile strength of the material - The shear and normal stresses lie on the Mohr- Coulomb failure envelope defined for the material

19
Determining Pressure Limits No Yield: Plasticity indicators were absent at the end of the calculation cycle Less than 20 percent edge at yield: There was some yield indicated, but was < 20% percent of the perimeter Greater than 20 percent edge at yield: Yield was indicated along > 20% of the cavern edge while cavern stability was maintained Failure indicated: Unbalanced force and displacements indicated that failure has occurred. Large portions of the cavern are at yield

20
Unbalanced Force: Indicator of system stability

21
System stable if ‘UF’ goes to zero Unbalanced Force: Indicator of system stability

22
Instability System stable if ‘UF’ goes to zero Unbalanced Force: Indicator of system stability

23
Steps Displacement as instability indicator: Pressure up to p* 1.5 then down to blowout Y displacement 10 -2 m

24
Create Cavern Steps Displacement as instability indicator: Pressure up to p* 1.5 then down to blowout Y displacement 10 -2 m P* 1.5 Return to Hydrostatic

25
Create Cavern Steps Displacement as instability indicator: Pressure up to p* 1.5 then down to blowout Y displacement 10 -2 m P* 1.5 Return to Hydrostatic Slope on y displacement plot indicates instability

26
Example: 10 x 200 m Domed Cylindrical Cavern

27
Plasticity Indicators at Pstar 1.6 during pressurization: First Yield

28
Maximum Principal Stress at Pstar 1.6 during pressurization: First Yield

29
Plasticity Indicators at Pstar 2.6 during pressurization: > 20% at Yield

30
Plasticity Indicators at Pstar 3.0 during pressurization: Failure Indicated

31
Maximum Principle Stress at Pstar 3.0 during pressurization : Failure Indicated

32
Maximum Principle Stress at Pstar ≈ 0 during depressurization : No Yield indictated

33
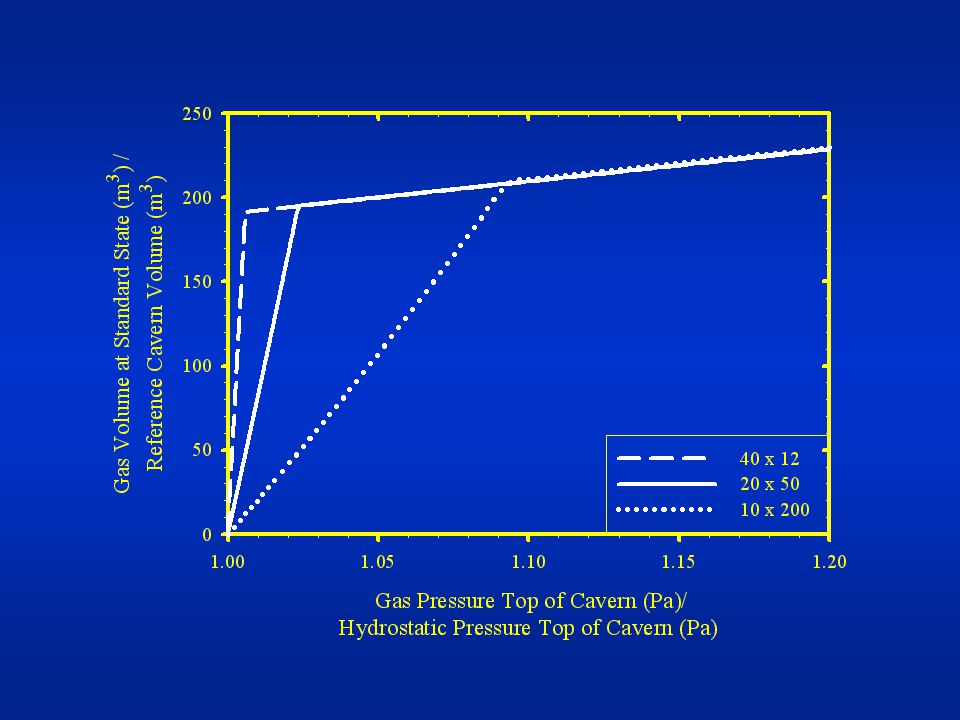
Gas Volume at Standard State in 10 x 200 m Domed Cylindrical Cavern

34
Gas Volume at Standard State in 20 x 50 m Cylindrical Cavern, k = 0.8

35
In-Situ Stress Ratio and Stability Stress Ratio Predicted Range ~ 0.4 -1.3 Simulated k of 0.4, 0.6, 0.8, 1.0, 1.2 Expected Range in Appalachian Basin 0.8-1.2

36
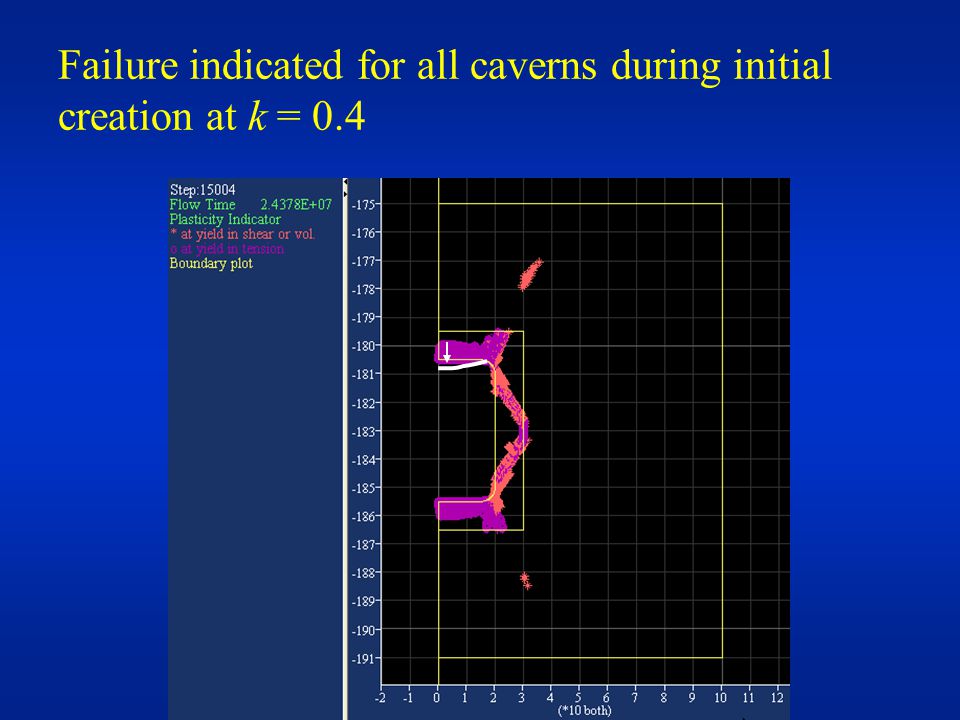
Failure indicated for all caverns during initial creation at k = 0.4

39
Stress Ratio 0.6Stress Ratio 0.8

40
Stress Ratio 1.0Stress Ratio 1.2

41
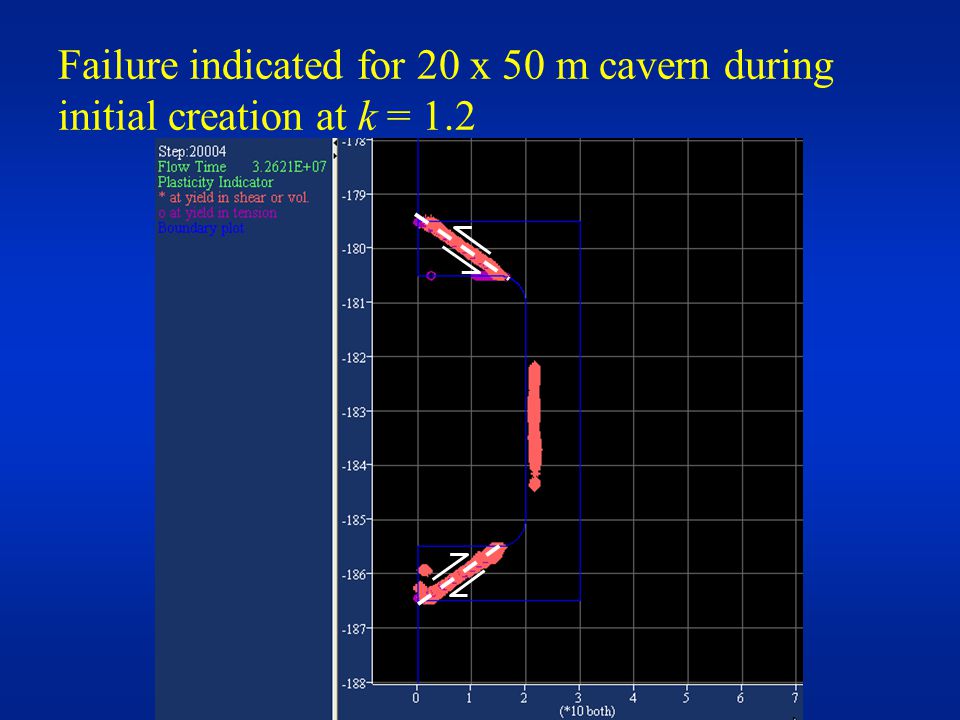
Failure indicated for 20 x 50 m cavern during initial creation at k = 1.2

44
Shape Summary Failure indicated first along flat roofs and floors Domed shapes would have greater stability Taller narrow cylindrical caverns more stable than shorter wider caverns Spherical cavern sable, but has higher percentage of yield along edge

45
Pressure Cycling Slow vs. Quick pressure changes Narrow vs. Broad pressure range

46
Slow Pressure Cycling from Pstar 1.0 to 1.5 in 20 x 50 m cylindrical cavern

47
Pressure Cycling from Pstar 1.0 to 1.3 in 10 x 200 m domed cylindrical cavern

48
Internal Pressure Pressure cycling may lead to cavern failure Slow pressure changes more stable than quick pressure changes Narrow pressure range more stable than broad pressure range

49
Conceptual Model Of Cavern Failure Low Horizontal: σ h < σ v High Horizontal: σ h > σ v One failure mechanism at High Internal Pressure Several failure mechanisms at Low Internal Pressure

50
Low Horizontal Far Field Stress: Local Stress: High Horizontal

51
Possible failure mechanisms at low internal pressures:

52
Utilizing simulations for cavern design Methodology for cavern design Suggestions of shapes to try

53
Suggestions for Cavern Design I.Select target storage volume II.Select cavern location III.Collect formation data: Porosity, Permeability, Physical and Mechanical Properties, in-situ stresses, Thickness, Adjacent layers… IV.Choose several possible geometries to simulate. The following chart can be used as an aid for shape selection:

54
(A) Stability predicted with less than 20% of cavern wall at yield (B) Stability predicted with greater than 20% of cavern wall at yield (C) Stability predicted over one cycle, failure of flat roof or floor predicted upon cycling. The same dimensions with a domed roof or floor will result in a suitable cavern. Conditionally Stable (B,C): Probable Unstable Conical 25 x 96 m Conditionally Stable (B): Probable Conditionally Stable (A): Probable Conditionally Stable (B): Probable Spherical r = 24.6 m Unstable Conditionally Stable (B): Unsuitable Conditionally Stable (A): Low possibility Conditionally Stable (B): Unsuitable Tunnel Stable: Recommended 10 x 200 m Domed Cylindrical Conditionally Stable (C): use domed 10 x 200 m Cylindrical Unstable Conditionally Stable (C): Probable Unstable 20 x 50 m Cylindrical Conditionally Stable (B,C): Low Possibility Conditionally Stable (B,C): Unsuitable Unstable 40 x 12 m Cylindrical 1.21.00.80.6 In-Situ Horizontal to Vertical Stress Ratio (k)
: Probable Unstable Conical 25 x 96 m Conditionally Stable (B): Probable Conditionally Stable (A): Probable Conditionally Stable (B): Probable Spherical r = 24.6 m Unstable Conditionally Stable (B): Unsuitable Conditionally Stable (A): Low possibility Conditionally Stable (B): Unsuitable Tunnel Stable: Recommended 10 x 200 m Domed Cylindrical Conditionally Stable (C): use domed 10 x 200 m Cylindrical Unstable Conditionally Stable (C): Probable Unstable 20 x 50 m Cylindrical Conditionally Stable (B,C): Low Possibility Conditionally Stable (B,C): Unsuitable Unstable 40 x 12 m Cylindrical In-Situ Horizontal to Vertical Stress Ratio (k).")
55
Suggestions for Cavern Design (continued) V.Simulate Selected Shapes in FLAC VI.Vary internal pressure to simulate working cavern VII.Observe where yield is indicated, if failure may result in new geometry, run model with inferred geometry VIII.If new shape has increased stability, cycle pressure between predicted maximum and minimum values IX.If stable under additional considerations, shape suitable for field test
 V.Simulate Selected Shapes in FLAC VI.Vary internal pressure to simulate working cavern VII.Observe where yield is indicated, if failure may result in new geometry, run model with inferred geometry VIII.If new shape has increased stability, cycle pressure between predicted maximum and minimum values IX.If stable under additional considerations, shape suitable for field test")
56
Other factors that need to be considered Formation heterogeneities around cavern Formation properties Influence of adjacent formations Faults Poro-elastic effects

57
Conclusions Tall domed cylindrical cavern has greatest stability range Rate of pressure cycling can affect stability Pressure range can affect stability Conceptual model of failure mechanisms Methods for cavern design

58
Acknowledgements Funded by the U.S. Department of Energy thorough the National Energy Technology Laboratory, Morgantown, WV. Advisor: Dr. Larry Murdoch Committee Members:Dr. Jim Castle Dr. Ron Falta

59
References: AGA, 2005, Fact Sheet: Overview of the U.S. Natural Gas Industry (2005), American Gas Association; Washington DC, http://www.aga.orghttp://www.aga.org Barron, T. F., 1994, Regulatory, technical pressures prompt more U.S. salt-cavern gas storage: Oil & Gas Journal, v. 92 (37), p. 55-67 Bary, A., Crotogino, F., Prevedel, B., Berger, H., Brown, K., Frantz, J., Sawyer, W., Henzell, M., Mohmeyer, K.-U., Ren, N.-K., Stiles, K. and Xiong, H., 2002, Storing Natural Gas Underground: Oilfield Review, v. 14 (2), p. 2-17. Castle, J. W., Bruce, D. A., Brame, S. E., Brooks, D. A., Falta, R. W. and Murdoch, L. C., 2004, Design and Feasibility of Creating Gas-Storage Caverns by Using Acid to Dissolve Carbonate Rock Formations: SPE Eastern Regional Meeting, p. 10. Society of Petroleum Engineers, Paper SPE 91436. Questions ? Part II, Hydraulic Fracturing…
, American Gas Association; Washington DC, Barron, T. F., 1994, Regulatory, technical pressures prompt more U.S. salt-cavern gas storage: Oil & Gas Journal, v. 92 (37), p Bary, A., Crotogino, F., Prevedel, B., Berger, H., Brown, K., Frantz, J., Sawyer, W., Henzell, M., Mohmeyer, K.-U., Ren, N.-K., Stiles, K. and Xiong, H., 2002, Storing Natural Gas Underground: Oilfield Review, v. 14 (2), p Castle, J. W., Bruce, D. A., Brame, S. E., Brooks, D. A., Falta, R. W. and Murdoch, L. C., 2004, Design and Feasibility of Creating Gas-Storage Caverns by Using Acid to Dissolve Carbonate Rock Formations: SPE Eastern Regional Meeting, p. 10. Society of Petroleum Engineers, Paper SPE Questions . Part II, Hydraulic Fracturing….")
Similar presentations