Download presentation
Presentation is loading. Please wait.

1
Monitoring Recreation Impacts in Vermont and the Northern Forest Kelly Goonan Robert Manning Carena van Riper Rubenstien School of Environment and Natural Resources University of Vermont Chris Monz College of Natural Resources Utah State University Park Studies Laboratory University of Vermont

2
Isolated & Confined

3
Rare & Fragile

4
Valuable & Popular

5
Management Objectives Facilitate public access Protect natural resources Preserve experiential quality

6
Objective IndicatorsMonitoring Standards Management by Objectives

7
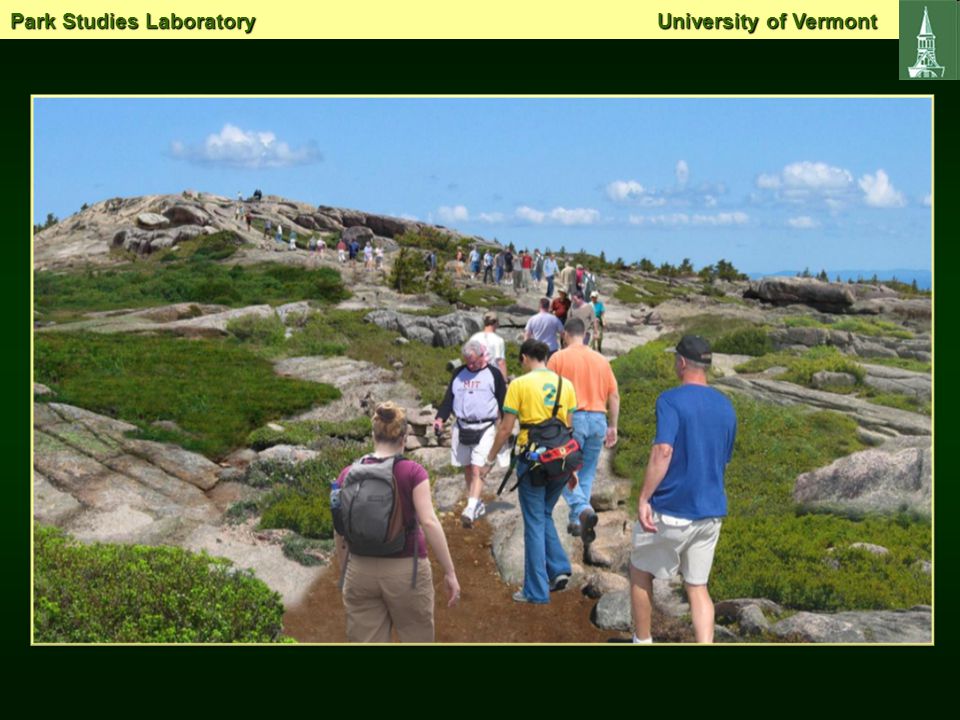
The Northern Forest Nearly 30 million acres Mosaic of public/private ownership Variety of recreational uses 1.5 million permanent residents 10 million visitors each year www.northernforest.org Park Studies Laboratory University of Vermont

8
Research Sites Cascade Mountain, NY Camel’s Hump, VT Cadillac Mountain, ME http://www.ncfcnfr.net/demo.html Park Studies Laboratory University of Vermont

9
Recreation Ecology Methods Mapped summit area using GPS –Cadillac : 71,020 m 2 –Cascade: 7,606 m 2 –Camel’s Hump: 5,336 m 2 All trails mapped and assessed Transect sampling and digital image analysis of 1m 2 quadrats to assess resource conditions and quantify land cover types Cascade, Adirondack State Park, NY

10
Recreation Ecology Methods: Land Cover Analysis

11
Adapted methods used in campsite impact analysis (Marion 1991) and range management (Booth and Cox 2008) Grid transect method Grid created using Hawth’s Analysis Tools in ArcGIS Digital images of 1m 2 quadrats Images analyzed using SamplePoint 13 land cover classes measured
 and range management (Booth and Cox 2008) Grid transect method Grid created using Hawth’s Analysis Tools in ArcGIS Digital images of 1m 2 quadrats Images analyzed using SamplePoint 13 land cover classes measured")
12
Recreation Ecology Methods: Land Cover Analysis

13
Ecological Assessment: Land Cover Analysis Land Cover Class Cascade Camel’s Hump CadillacF-valuep-value Vegetation 20.40 a,c 44.25 a 44.29 c 32.879<.001 Lichens 3.14 a,c 32.70 a 36.25 c 116.557<.001 Organic Soil 1.78 a,c 0.52 a 0.39 c 11.047<.001 Mineral Soil 4.72 a 0.59 a,b 6.73 b 20.703<.001 Bare Rock 68.45 a,c 20.11 a,b 11.27 b,c 369.198<.001 Any two summits that share a superscript are significantly different (p < 0.05) according to Bonferroni’s least significant difference test
 according to Bonferroni’s least significant difference test")
14
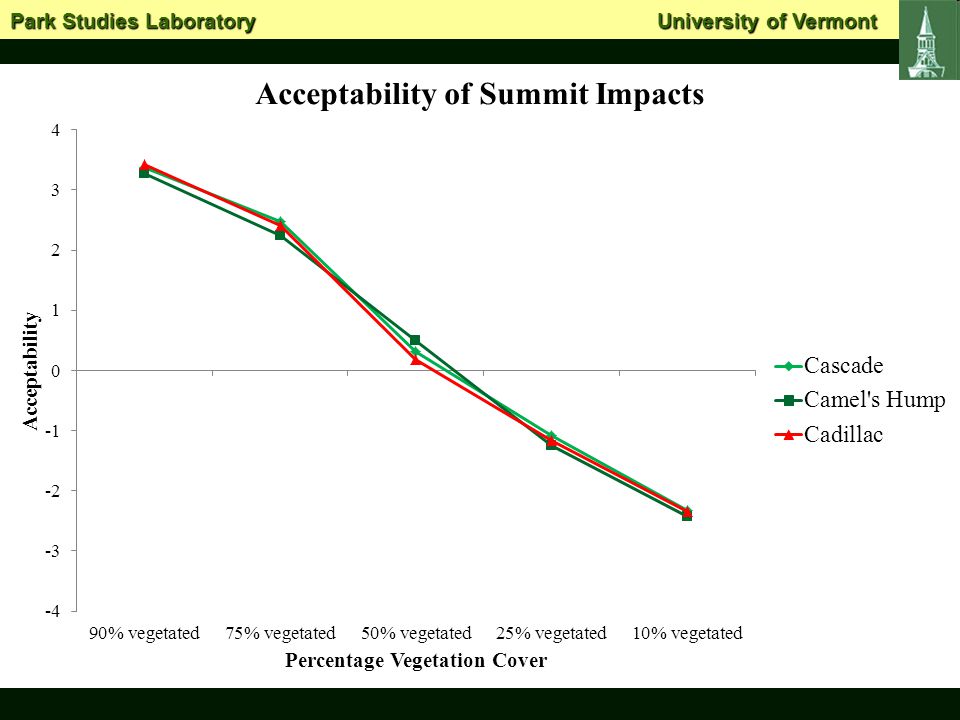
Cascade Camel’s Hump Cadillac Mountain Percent Vegetation Cover Present 20.444.3 Visitors said they typically saw… 61.767.072.0 Acceptability 44.342.946.7

15
Park Studies Laboratory University of Vermont

17
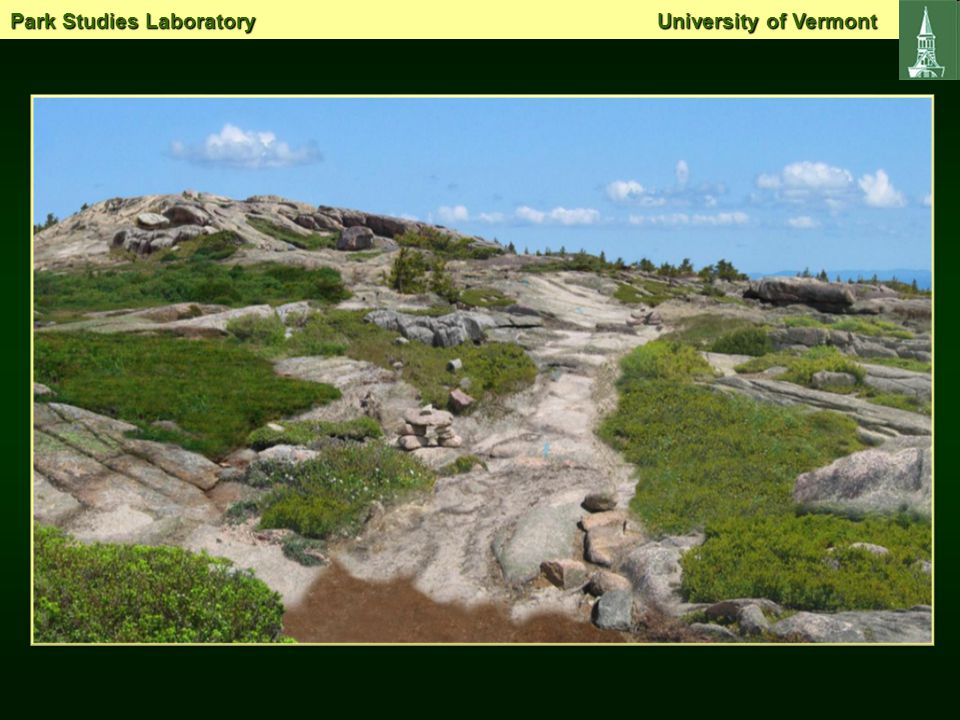
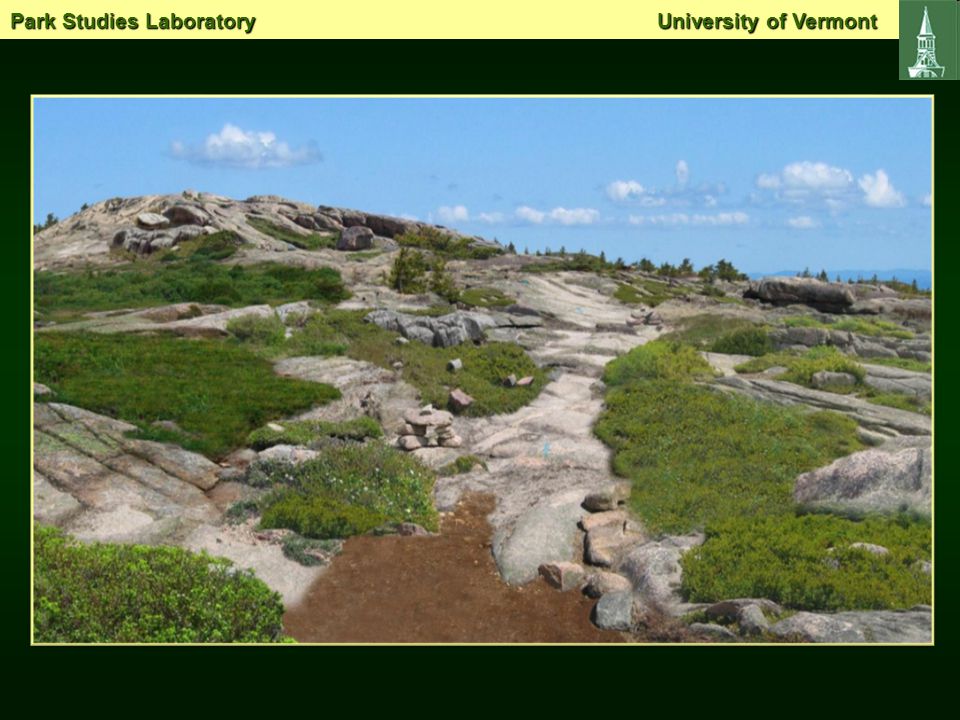
Visitor Awareness of Ecological Impacts About 45% of visitors noticed impacts –Cascade: 56% –Camel’s Hump: 37% –Cadillac Mountain: 45% Visitors tended to rate impacts as “slight” or “moderate” Ecological assessments would describe impacts as severe on Cascade and moderate to severe on Camel’s Hump and Cadillac Mountain Cascade, Adirondack State Park, NY

18
Visitor Awareness of Ecological Impacts About 45% of visitors noticed impacts –Cascade: 56% –Camel’s Hump: 37% –Cadillac Mountain: 45% Visitors tended to rate impacts as “slight” or “moderate” Ecological assessments would describe impacts as severe on Cascade and moderate to severe on Camel’s Hump and Cadillac Mountain Cascade, Adirondack State Park, NY

19
Special Thanks Laura Anderson Lauren Chicote Carena van Riper & Pete Pettengill Bill Valliere New York State DEC Green Mountain ClubVermont Nongame Natural Heritage Program Vermont Dept. of Forests, Parks & Recreation Acadia NP The VT Crew Northeastern States Research Cooperative Park Studies Laboratory University of Vermont

33
Survey Research Methods On-site visitor survey conducted during summer and fall 2008 (n = 476; 82.9% response) –Cascade: n=126, 92% response –Camel’s Hump: n=157, 92.4% response –Cadillac: n=193, 72.3% response Objectives: –Identify indicators of quality –Identify standards of quality for selected indicator variables Park Studies Laboratory University of Vermont
 –Cascade: n=126, 92% response –Camel’s Hump: n=157, 92.4% response –Cadillac: n=193, 72.3% response Objectives: –Identify indicators of quality –Identify standards of quality for selected indicator variables Park Studies Laboratory University of Vermont")
41
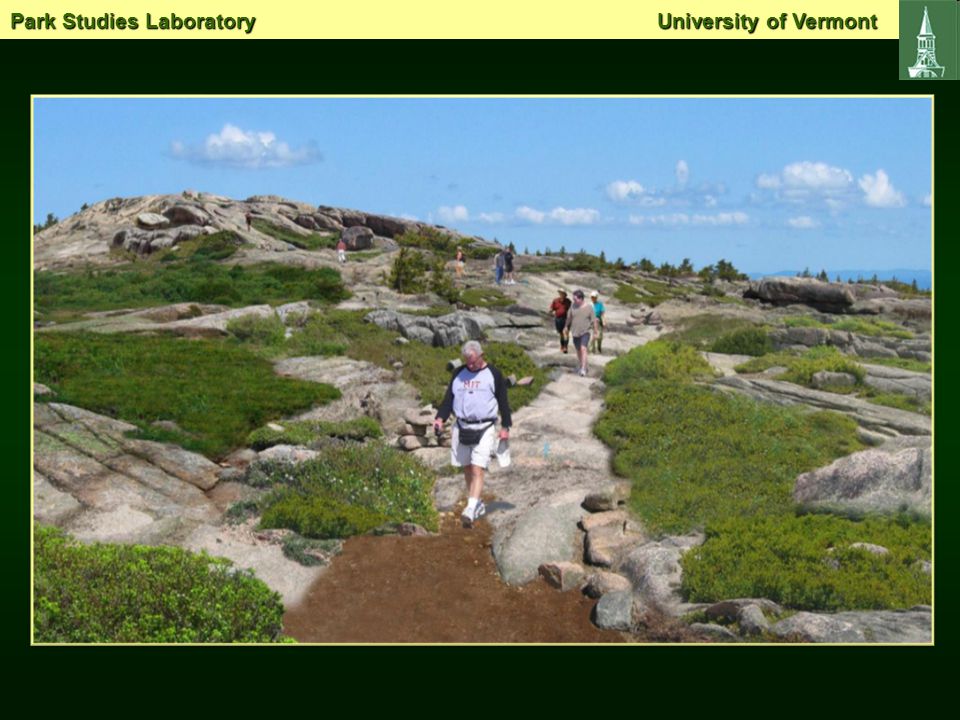
Summary of Respondent Ratings of On-trail Use Level Photographs Cascade (n = 117-124) Camel’s Hump (n = 143-156) Cadillac (n = 177-192) ANOVA Use Level Mean F-valuep-value 0 people 3.563.673.381.722.180 9 people 2.68 a 2.14 a,b 3.10 b 13.474<.001 18 people 1.08 c 0.63 b 1.85 b,c 13.051<.001 27 people -0.73 c -0.93 b 0.13 b,c 9.479<.001 36 people -2.38 c -2.47 b -1.51 b,c 8.918<.001 Acceptability 23.3721.6327.71 Typically Seen 13.59 a,c 10.71 a,b 19.08 b,c 43.367<.001 Any two summits that share a superscript are significantly different (p < 0.05) according to Bonferroni’s least significant difference test Park Studies Laboratory University of Vermont
 Camel’s Hump (n = ) Cadillac (n = ) ANOVA Use Level Mean F-valuep-value 0 people people 2.68 a 2.14 a,b 3.10 b < people 1.08 c 0.63 b 1.85 b,c < people c b 0.13 b,c 9.479< people c b b,c 8.918<.001 Acceptability Typically Seen a,c a,b b,c <.001 Any two summits that share a superscript are significantly different (p < 0.05) according to Bonferroni’s least significant difference test Park Studies Laboratory University of Vermont")
54
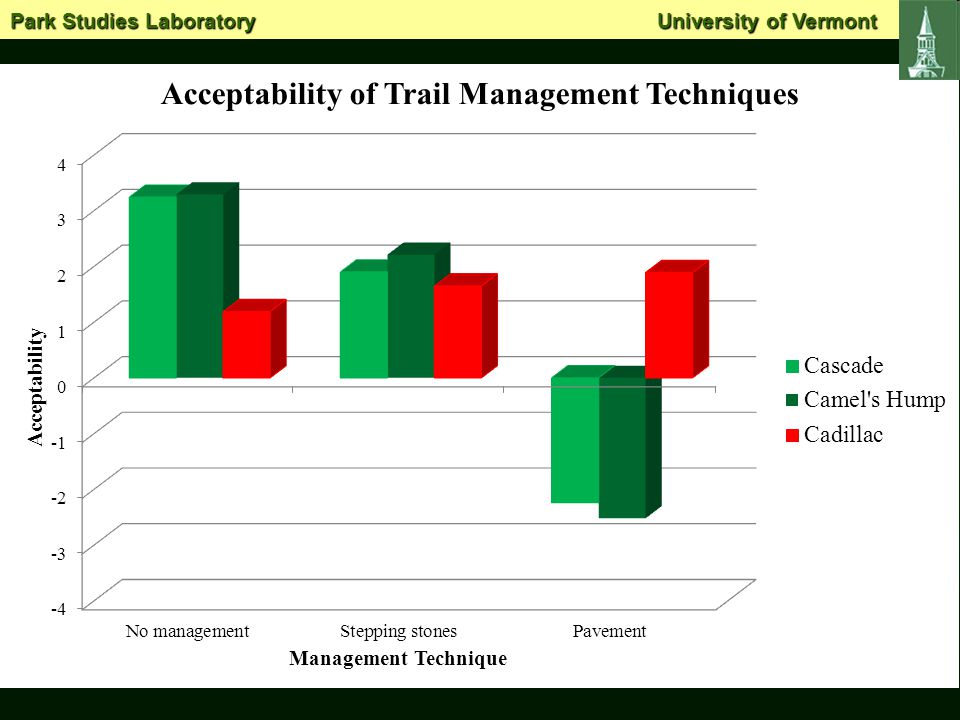
Conclusions Cascade visitors sensitive to Off trail summit use Impacts from off trail summit use “Obtrusive” management instillations Cascade visitors NOT sensitive to Trail impacts “Natural” management instillations Park Studies Laboratory University of Vermont

55
Recreation Ecology Methods Mapped summit area using GPS –Cadillac : 71,020 m 2 –Cascade: 7,606 m 2 –Camel’s Hump: 5,336 m 2 All trails mapped and assessed Transect sampling and digital image analysis of 1m 2 quadrats to assess resource conditions and quantify land cover types Cascade, Adirondack State Park, NY

56
Recreation Ecology Methods: Land Cover Analysis

57
Adapted methods used in campsite impact analysis (Marion 1991) and range management (Booth and Cox 2008) Grid transect method Grid created using Hawth’s Analysis Tools in ArcGIS Digital images of 1m 2 quadrats Images analyzed using SamplePoint 13 land cover classes measured
 and range management (Booth and Cox 2008) Grid transect method Grid created using Hawth’s Analysis Tools in ArcGIS Digital images of 1m 2 quadrats Images analyzed using SamplePoint 13 land cover classes measured")
58
Recreation Ecology Methods: Land Cover Analysis

59
Ecological Assessment: Trail Analysis - Cascade Number of Segments45 Linear Extent (miles)0.26 Average Trail Width (inches): Minimum8 Maximum30 Mean15.3 Condition Class: CC16.7% CC226.7% CC333.3% CC424.4%
0.26 Average Trail Width (inches): Minimum8 Maximum30 Mean15.3 Condition Class: CC16.7% CC226.7% CC333.3% CC424.4%")
60
Ecological Assessment: Land Cover Analysis Land Cover Class Cascade Camel’s Hump CadillacF-valuep-value Vegetation 20.40 a,c 44.25 a 44.29 c 32.879<.001 Lichens 3.14 a,c 32.70 a 36.25 c 116.557<.001 Organic Soil 1.78 a,c 0.52 a 0.39 c 11.047<.001 Mineral Soil 4.72 a 0.59 a,b 6.73 b 20.703<.001 Bare Rock 68.45 a,c 20.11 a,b 11.27 b,c 369.198<.001 Any two summits that share a superscript are significantly different (p < 0.05) according to Bonferroni’s least significant difference test
 according to Bonferroni’s least significant difference test")
61
Cascade Camel’s Hump Cadillac Mountain Percent Vegetation Cover Present 20.444.3 Visitors said they typically saw… 61.767.072.0 Acceptability 44.342.946.7

62
UNIVERSITY OF VERMONT PARK STUDIES LABORATORY http://www.uvm.edu/parkstudies/ View of the Great Range from summit of Cascade, Adirondack State Park, NY Park Studies Laboratory University of Vermont

Similar presentations


>")
