Download presentation
Presentation is loading. Please wait.

1
ECOLOGICAL NICHE MODELS OF PLAGUE IN UZBEKISTAN : EXTRACTING BIOLOGICAL INFORMATION FROM MULTIPLE- SPECIES MODELS VS. SPECIES SPECIFIC MODELS TO UNDERSTAND HOSTS AND VECTORS Jason K. Blackburn, PhD, Emerging Pathogens Institute & Department of Geography, University of Florida, Gainesville, FL USA Shalo Rakimova, PhD, Aminjan Nematov, PhDShalo Rakimova, PhD, Aminjan Nematov, PhD Center for GIS, Center for Prophylaxis and Quarantine for Most Hazardous Infections, Tashkent, Uzbekistan Christopher Shane FosterChristopher Shane Foster Department of Geography, California State University, Fullerton, CA USADepartment of Geography, California State University, Fullerton, CA USA

2
This Cooperative Biological Research project was funded by the United States Defense Threat Reduction Agency (DTRA) as part of the Biological Threat Reduction Program in Uzbekistan
 as part of the Biological Threat Reduction Program in Uzbekistan")
3
Sporadic human cases of plague were documented in 1979 and 1999 in Uzbekistan and plague remains a threat to public health CPQMHI maintains an active surveillance effort for natural presence of the disease in rodent and flea populations throughout the known regions of historical cases Zoological surveillance remains a priority for plague, as both human and enzootic cases appear to be related to host/reservoir populations

4
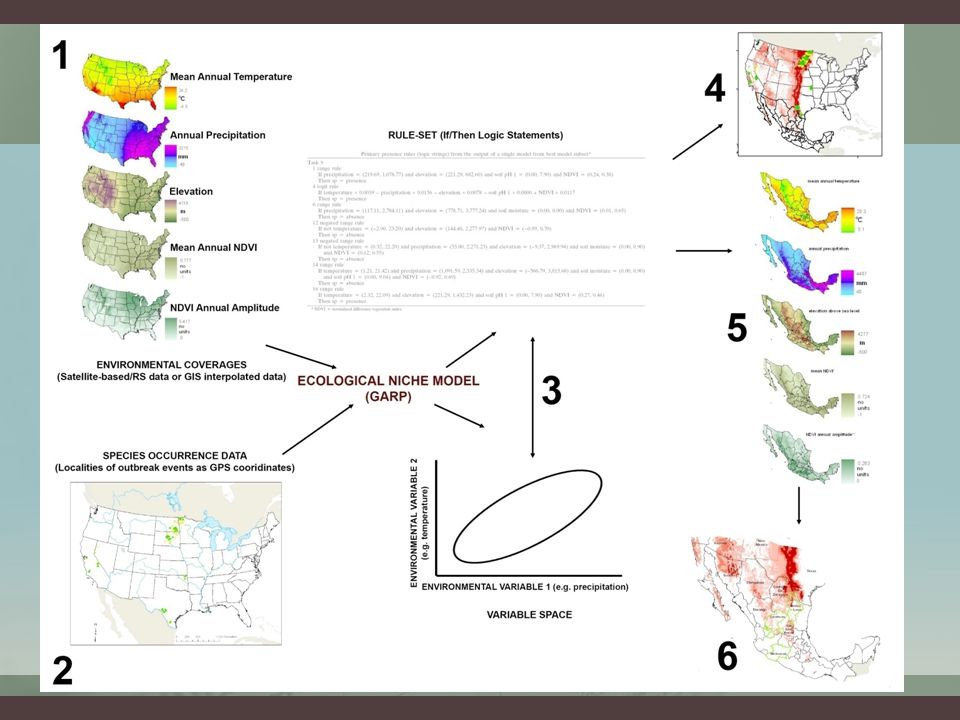
Ecological niche modeling (ENM) predicts the potential geographic distribution of species’ through the analysis of non-random relationships between environmental variables (e.g. – temperature, precipitation, elevation, etc) and laboratory positive sample locations The idea is to model the distribution of the species in areas where surveillance may be lacking This study employed plague locations and species-specific occurrence data from field studies and several environmental variables to model the ecological niche for Y. pestis in Uzbekistan
 and laboratory positive sample locations The idea is to model the distribution of the species in areas where surveillance may be lacking This study employed plague locations and species-specific occurrence data from field studies and several environmental variables to model the ecological niche for Y. pestis in Uzbekistan.")
5
Fundamental Niche ENVIRONMENTAL PARAMETER 1 (e.g. vegetation) ENVIRONMENTAL PARAMETER 2 (e.g. soil pH) Realized Niche (Grinnell 1917, Hutchinson 1957) (Grinnell 1917, Hutchinson 1957)
 Realized Niche (Grinnell 1917, Hutchinson 1957) (Grinnell 1917, Hutchinson 1957).")
6
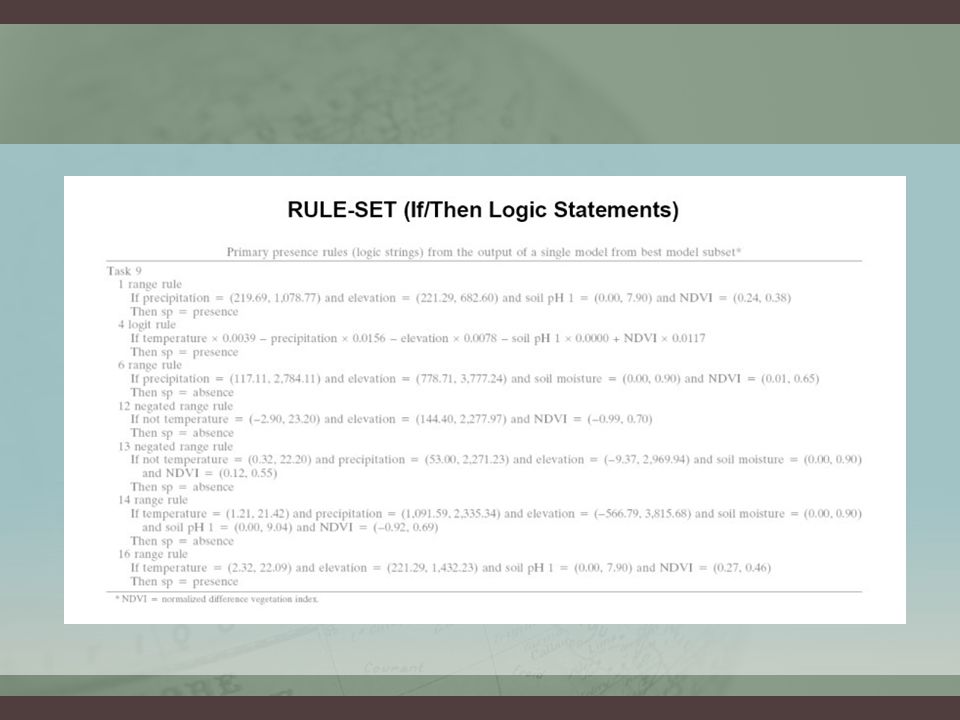
Stockwell and Peters (1999) This study employed the GARP modeling system to predict the niche for plague Iterative modeling approach where rules define the distribution as PRESENT or ABSENT Once the rules are developed, they are mapped onto the geography to map the potential distribution GARP is an iterative modeling system that builds rules that relate points to ecological variables GARP is stochastic (like many approaches) and multi-model development and agreement are used to determine accuracy/relevance
 This study employed the GARP modeling system to predict the niche for plague Iterative modeling approach where rules define the distribution as PRESENT or ABSENT Once the rules are developed, they are mapped onto the geography to map the potential distribution GARP is an iterative modeling system that builds rules that relate points to ecological variables GARP is stochastic (like many approaches) and multi-model development and agreement are used to determine accuracy/relevance")
9
Peterson et al. 2002 (Chagas) MODEL HOST SPECIES MODEL VECTOR SPECIESOVERLAP MODEL HOSTS AND VECTORS AND IDENTIFY OVERLAP
 MODEL HOST SPECIES MODEL VECTOR SPECIESOVERLAP MODEL HOSTS AND VECTORS AND IDENTIFY OVERLAP.")
10
Peterson et al. 2004 (Ebola) MODEL HUMAN CASES OR MODEL ENTIRE HOST RANGE Williams et al. 2007 (Avian Influenza) Levine et al. 2007 (Monkey Pox)
 Levine et al (Monkey Pox).")
11
Neerinckx et al. (2008) MODEL HUMAN CASES OF PLAGUE: Explore “Niche Space”
 MODEL HUMAN CASES OF PLAGUE: Explore Niche Space")
12
SPECIES OCCURRENCE DATA: PLAGUE CASES FROM 2000 - 2007 1 2 3 4 Plague FleasXenopsylla fleas Rodents (with or w/o plague) Rhombomys opimus (w or w/o plague) Meriones spp. (2 separate models)
.")
13
Variable NameDescriptionSpatial ResolutionSource wd0103a0mean MIR1 kmHay et al. (2006) wd0103a1MIR annual amplitude ( ◦ C)1 kmHay et al. (2006) wd0103mnminimum MIR (◦C)1 kmHay et al. (2006) wd0103mxmaximum MIR (◦C)1 kmHay et al. (2006) wd0107a0mean LST (◦C)1 kmHay et al. (2006) wd0107a1LST annual amplitude (◦C)1 kmHay et al. (2006) wd0107mnminimum LST (◦C)1 kmHay et al. (2006) wd0107mxmaximum LST (◦C)1 kmHay et al. (2006) wd0114a0mean NDVI (◦C)1 kmHay et al. (2006) wd0114a1annual amplitude NDVI (◦C)1 kmHay et al. (2006) wd0114mnminimum NDVI (◦C)1 kmHay et al. (2006) wd0114mxmaximum NDVI (◦C)1 kmHay et al. (2006) altAltitude (m)1 kmwww.worldclim.org Mean LST Mean NDVI
 wd0103a1MIR annual amplitude ( ◦ C)1 kmHay et al. (2006) wd0103mnminimum MIR (◦C)1 kmHay et al. (2006) wd0103mxmaximum MIR (◦C)1 kmHay et al. (2006) wd0107a0mean LST (◦C)1 kmHay et al. (2006) wd0107a1LST annual amplitude (◦C)1 kmHay et al. (2006) wd0107mnminimum LST (◦C)1 kmHay et al. (2006) wd0107mxmaximum LST (◦C)1 kmHay et al. (2006) wd0114a0mean NDVI (◦C)1 kmHay et al. (2006) wd0114a1annual amplitude NDVI (◦C)1 kmHay et al. (2006) wd0114mnminimum NDVI (◦C)1 kmHay et al. (2006) wd0114mxmaximum NDVI (◦C)1 kmHay et al. (2006) altAltitude (m)1 kmwww.worldclim.org Mean LST Mean NDVI.")
14
Predicted geography from niche models was plotted in 2x2 variable space to illustrate differences in realized niche space for each model developed in this study

15
Predicted distributions of “plague”: Using all Y. pestis positives MetricPlague n to build models76 n to test models (independent)25 Total Omission4 Average Omission14 Total Commission40.13 Average Commission27.8 AUC (z, SE)0.7638 (7.74**, 0.056) Total % area predicted by 6 or more39.1
25 Total Omission4 Average Omission14 Total Commission40.13 Average Commission27.8 AUC (z, SE) (7.74**, 0.056) Total % area predicted by 6 or more39.1.")
16
Predicted distributions of plague: Fleas MetricFleas n to build models22 n to test models (independent)7 Total Omission14.3 Average Omission2.4 Total Commission49.19 Average Commission33.35 AUC (z, SE)0.6945 (3.41**, 0.115) Total % area predicted by 6 or more50.4
7 Total Omission14.3 Average Omission2.4 Total Commission49.19 Average Commission33.35 AUC (z, SE) (3.41**, 0.115) Total % area predicted by 6 or more50.4")
17
Predicted distributions of plague: Plague vs Fleas MetricPlague Model/Flea metrics n to build models76 n to test models (independent)29 Total Omission17.2 Average Omission16.5 Total CommissionNA Average CommissionNA AUC (z, SE)0.72 (8.2**, 0.05) Total % area predicted by 6 or moreNA
29 Total Omission17.2 Average Omission16.5 Total CommissionNA Average CommissionNA AUC (z, SE)0.72 (8.2**, 0.05) Total % area predicted by 6 or moreNA")
18
MetricRodent n to build models133 n to test models (independent)44 Total Omission4.5 Average Omission8.7 Total Commission41.8 Average Commission33.8 AUC (z, SE)0.7778 (11.6**, 0.0415) Total % area predicted by 6 or more42.0 Predicted distributions of plague: Rodents Model (all rodent species)
44 Total Omission4.5 Average Omission8.7 Total Commission41.8 Average Commission33.8 AUC (z, SE) (11.6**, ) Total % area predicted by 6 or more42.0 Predicted distributions of plague: Rodents Model (all rodent species)")
19
Predicted distributions of plague: Rhombomys opimus MetricRhombomys opimus n to build models158 n to test models (independent)52 Total Omission0 Average Omission14 Total Commission34.08 Average Commission15.48 AUC (z, SE)0.8595 (11.9**, 0.0328) Total % area predicted by 6 or more32.3
52 Total Omission0 Average Omission14 Total Commission34.08 Average Commission15.48 AUC (z, SE) (11.9**, ) Total % area predicted by 6 or more32.3")
20
Predicted distributions of plague: M. erythrourus (taxonomic review?) MetricM. erythrourus † n to build models6 n to test models (independent)NA Total OmissionNA Average OmissionNA Total Commission11.31 Average Commission8.73 AUC (z, SE)NA Total % area predicted by 6 or more11.0
NA Total OmissionNA Average OmissionNA Total Commission11.31 Average Commission8.73 AUC (z, SE)NA Total % area predicted by 6 or more11.0.")
21
Predicted distributions of plague: M. meridianus MetricM. meridianus n to build models46 n to test models (independent)15 Total Omission0 Average Omission0.7 Total Commission27.93 Average Commission20.99 AUC (z, SE)0.8763 (7.08**,0.058) Total % area predicted by 6 or more26.8
15 Total Omission0 Average Omission0.7 Total Commission27.93 Average Commission20.99 AUC (z, SE) (7.08**,0.058) Total % area predicted by 6 or more26.8.")
22
Predicted distributions of plague: WHICH NICHE? MetricR. opimus Model/M. meridianus metricsR. opimus Model/M. erythrourus metrics n to build models158 n to test models (independent)616 Total Omission00 Average Omission7.710 Total CommissionNA Average CommissionNA AUC (z, SE)0.87 (13.0**, 0.03)0.88 (3.5**, 0.09) Total % area predicted by 6 or moreNA
616 Total Omission00 Average Omission7.710 Total CommissionNA Average CommissionNA AUC (z, SE)0.87 (13.0**, 0.03)0.88 (3.5**, 0.09) Total % area predicted by 6 or moreNA.")
23
Predicted distributions of plague: WHICH NICHE? MetricPlague Model/ R. opimus metrics n to build models76 n to test models (independent)210 Total Omission8.6 Average Omission23.1 Total CommissionNA Average CommissionNA AUC (z, SE)0.73 (22.4**, 0.02) Total % area predicted by 6 or moreNA
210 Total Omission8.6 Average Omission23.1 Total CommissionNA Average CommissionNA AUC (z, SE)0.73 (22.4**, 0.02) Total % area predicted by 6 or moreNA.")
24
Mixed mammal models are more reflective of the larger sample size While successfully predicting test data, these models confound ecological signatures and are therefore not hugely informative Flea models predicted the greatest geographic area, again confounding the ecological signature (niche definition) of any given host species The “plague model” under predicted the R. opimus model, suggesting the “disease distribution” is a subset of host distributions Overall, mixed species models are difficult to interpret and can either over or under predict any given component of the transmission cycle. While the geography may be captured, it may not be biologically meaningful when compared to specific models What do the models mean?

25
GARP can be interpreted as a “fundamental niche” modeling tool – but this relies on a Grinnellian definition of a single niche per species; modeling multi-species data sets conflates this definition and confuses the ecological space occupied by any given species of the enzootic transmission cycle of plague in Uzbekistan Extrapolating potential geography to niche space (here 2x2 plots) illustrates the ecological space occupied by any individual species within the data set and compares each to the “plague” definition Summary Evaluating each species individually both adheres to the traditional ecological niche theory and provides an opportunity to evaluate possible differences in regional ecologies that comprise the “plague foci” of Uzbekistan
 illustrates the ecological space occupied by any individual species within the data set and compares each to the plague definition Summary Evaluating each species individually both adheres to the traditional ecological niche theory and provides an opportunity to evaluate possible differences in regional ecologies that comprise the plague foci of Uzbekistan")
Similar presentations


 This PowerPoint template requires basic PowerPoint (version 2007 or newer) skills. Below is a list of commonly.>")


