Download presentation
Presentation is loading. Please wait.

1
EXAM #3 Review Slides

2
Open pit coal mine and a lump of anthracite coal.

3
Oil pumpjack near Lubbock, Texas and an oil derrick (drilling rig) in Okemah, Oklahoma circa 1922.
 in Okemah, Oklahoma circa 1922.")
4
Natural gas processing plant and basic processing steps.

5
Pitchblende, a uranium bearing ore and a nuclear power plant in Pennsylvania.

6
World Nuclear power 6% Hydropower, geothermal, solar, wind 7% Natural Gas 12% Biomass 11% Oil 32% Coal 21%

7
United States Nuclear power 8% Hydropower geothermal solar, wind 4% Biomass 4% Natural Gas 23% Oil 39% Coal 22%

8
Solar water heater

9
Nellis solar power plant on Nellis Air Force Base, Nevada.

10
Thorntonbank wind farm off the coast of Belgium and a wind farm in southern California.

11
Three Gorges Dam in China, the largest hydro-electric power station.

12
The Nesjavellar Geothermal Power Plant in Iceland.

13
Types of vegetation that can be used as biomass fuels.

14
Energy consumption in the U.S., 1860 to 2000.

15
Mined coal Pipeline Pump Oil well Gas well Oil storage Coal Oil and Natural Gas Geothermal Energy Hot water storage Contour strip mining Pipeline Drilling tower Magma Hot rock Natural gas Oil Impervious rock Water Oil drilling platform on legs Floating oil drilling platform Valves Underground coal mine Water is heated and brought up as dry steam or wet steam Water penetrates down through the rock Area strip mining Geothermal power plant Coal seam

16
MEXICO UNITED STATES CANADA Pacific Ocean Atlantic Ocean Grand Banks Gulf of Alaska Valdez ALASKA Beaufort Sea Prudhoe Bay Arctic Ocean Coal Gas Oil High potential areas Prince William Sound Arctic National Wildlife Refuge Trans Alaska oil pipeline

17
The Hydrologic (Water) Cycle
 Cycle")
18
The distribution of water at the Earth’s surface.

19
The water molecule & phase changes.

20
Water may flow over the surface or infiltrate into the soil.

21
Three basic components of a groundwater system.

22
Unconfined aquifer & Groundwater characteristics and dangers.

23
Confined aquifer & Groundwater characteristics and dangers.

24
Confined groundwater system (aquifer)
")
25
Springs along the Snake River, Idaho.

26
Development of ground subsidence.

27
Saltwater encroachment

28
5,500 5,000 4,500 4,000 3,500 3,000 2,500 2,000 1,500 1,000 500 190019201940196019802000 Water use (cubic kilometers per year) Total use Agricultural use Industrial use Domestic use Year
 Total use Agricultural use Industrial use Domestic use Year")
29
United StatesChina Industry 11%Public 10% Power cooling 38% Agriculture 41% Agriculture 87% Public 6%Industry 7%

30
Acute shortage Shortage Adequate supply Metropolitan regions with population greater than 1 million

31
HighNone North America South America Level of Stress Africa Europe Asia Australia Level of stress on major river basins, comparing the amount of water available with the amount used by humans.

32
Large losses of water through evaporation Flooded land destroys forests or cropland and displaces people Downstream flooding is reduced Downstream cropland and estuaries are deprived of nutrient-rich silt Reservoir is useful for recreation and fishing Can produce cheap electricity (hydropower) Migration and spawning of some fish are disrupted Provides water for year-round irrigation of cropland
 Migration and spawning of some fish are disrupted Provides water for year-round irrigation of cropland")
33
North Bay Aqueduct South Bay Aqueduct California Aqueduct CALIFORNIA NEVADA UTAH MEXICO Central Arizona Project Colorado River Aqueduct Los Angeles Aqueduct Shasta Lake Oroville Dam and Reservoir Feather River Lake Tahoe Sacramento Fresno Hoover Dam and Reservoir (Lake Mead) Salton Sea Phoenix Tucson ARIZONA Colorado River Sacramento River San Francisco San Luis Dam and Reservoir Santa Barbara Los Angeles San Diego
 Salton Sea Phoenix Tucson ARIZONA Colorado River Sacramento River San Francisco San Luis Dam and Reservoir Santa Barbara Los Angeles San Diego")
34
This plant supplies 25 MGD by filtration & reverse osmosis processes. Tampa Bay, FL desalination plant.

35
Lining canals bringing water to irrigation ditches Leveling fields with lasers Irrigating at night to reduce evaporation Using soil and satellite sensors and computer systems to monitor soil moisture and add water only when necessary Polyculture Organic farming Growing water-efficient crops using drought-resistant and salt-tolerant crop varieties Irrigating with treated urban waste water Importing water-intensive crops and meat

36
Redesign manufacturing processes Landscape yards with plants that require little water Use drip irrigation Fix water leaks Use water meters and charge for all municipal water use Raise water prices Require water conservation in water-short cities Use water-saving toilets, showerheads, and front-loading clothes washers Collect and reuse household water to irrigate lawns and nonedible plants Purify and reuse water for houses, apartments, and office buildings

37
Not depleting aquifers Preserving ecological health of aquatic systems Preserving water quality Integrated watershed management Agreements among regions and countries sharing surface water resources Outside party mediation of water disputes between nations Marketing of water rights Wasting less water Decreasing government subsides for supplying water Increasing government subsides for reducing water waste Slowing population growth

38
The primary gases of the lower atmosphere.

40
The various layers of the modern atmosphere.

41
The 3 primary variable gases in the lower atmosphere.

42
Steady rise in carbon dioxide levels in the atmosphere.

43
Rise in atmospheric methane gas.

44
Water vapor in the atmosphere.

45
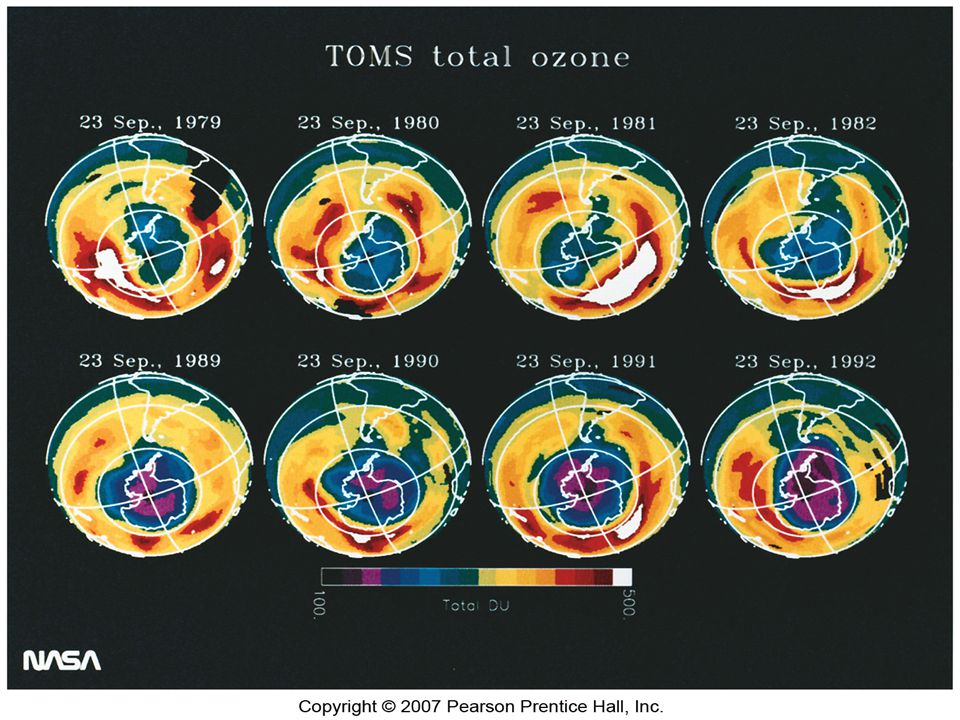
The Antarctic Ozone “Hole” on Sept. 24, 2006.

47
Ultraviolet light hits a chlorofluorocarbon (CFC) molecule, such as CFCl 3, breaking off a chlorine atom and leaving CFCl 2. UV radiation Sun Once free, the chlorine atom is off to attack another ozone molecule and begin the cycle again. A free oxygen atom pulls the oxygen atom off the chlorine monoxide molecule to form O 2. The chlorine atom and the oxygen atom join to form a chlorine monoxide molecule (ClO). The chlorine atom attacks an ozone (O 3 ) molecule, pulling an oxygen atom off it and leaving an oxygen molecule (O 2 ). Cl C F O O O O O O O O O O Summary of Reactions CCl 3 F + UV→ Cl + CCl 2 F Cl + O 3 ClO + O 2 Cl + O Cl + O 2 Repeated many times Break-up of Ozone
. The chlorine atom attacks an ozone (O 3 ) molecule, pulling an oxygen atom off it and leaving an oxygen molecule (O 2 ). Cl C F O O O O O O O O O O Summary of Reactions CCl 3 F + UV→ Cl + CCl 2 F Cl + O 3 ClO + O 2 Cl + O Cl + O 2 Repeated many times Break-up of Ozone.")
48
Human Health Worse sunburn More eye cataracts More skin cancers Immune system suppression Food and Forests Reduced yields for some crops Reduced seafood supplies from reduced phytoplankton Decreased forest productivity for UV-sensitive tree species Wildlife Increased eye cataracts in some species Decreased population of aquatic species sensitive to UV radiation Reduced population of surface phytoplankton Disrupted aquatic food webs from reduced phytoplankton Air Pollution and Materials Increased acid deposition Increased photochemical smog Degradation of outdoor paints and plastics Global Warming Accelerated warming because of decreased ocean uptake of CO 2 from atmosphere by phytoplankton and CFCs acting as greenhouse gases Potential effects of decreased levels of stratospheric ozone.

49
Pressure & altitude show an inverse relationship. Pressure decreases as altitude increases.

50
Tº is a function of pressure & volume. The average molecular motion of an object or substance is its temperature (Tº).
..")
53
Trend in T˚ change as compared to today’s T˚.

54
Oxygen isotope analysis of marine fossils. When seawater T°s are colder the ratio in ice cores is more 16 O than 18 O than under warmer conditions, and in seashells more 18 O than 16 O than under warmer conditions.

55
Recent climate variations using ice core samples from Greenland.

56
Use of tree rings to decipher past climatic change.

57
Pine pollen under the microscope for use in palynology studies. Pollen cores being taken at Ft. Bragg, NC.

59
Trend in CO 2 levels over past 250 years.

60
Trend in Earth’s average T˚ over the last 120 years.

61
Correlation of carbon emissions, CO 2 atmospheric levels, & T˚ change over past 1000 years.

62
CO 2 emissions per mile (pounds per passenger)Type of Transportation 1.6 (0.45 kilograms per kilometer) Sports utility vehicle (1 person, 15 mpg) Average car (1 person, 21.5 mpg) Jet (U.S average occupancy) Mass transit (1/4 full) Economy car (1 person, 40 mpg) Intercity train (U.S average occupancy) Carpool (3 people, 21.5 mpg) Mass transit (3/4 full) Bike or walk0 1.1 (0.31 kilograms per kilometer) 0.97 (0.27 kilograms per kilometer) 0.75 (0.21 kilograms per kilometer) 0.59 (0.71 kilograms per kilometer) 0.45 (0.13 kilograms per kilometer) 0.37 (0.10 kilograms per kilometer) 0.26 (0.07 kilograms per kilometer)
Type of Transportation 1.6 (0.45 kilograms per kilometer) Sports utility vehicle (1 person, 15 mpg) Average car (1 person, 21.5 mpg) Jet (U.S average occupancy) Mass transit (1/4 full) Economy car (1 person, 40 mpg) Intercity train (U.S average occupancy) Carpool (3 people, 21.5 mpg) Mass transit (3/4 full) Bike or walk0 1.1 (0.31 kilograms per kilometer) 0.97 (0.27 kilograms per kilometer) 0.75 (0.21 kilograms per kilometer) 0.59 (0.71 kilograms per kilometer) 0.45 (0.13 kilograms per kilometer) 0.37 (0.10 kilograms per kilometer) 0.26 (0.07 kilograms per kilometer)")
63
The simplistic “Greenhouse Effect”.

64
The atmosphere is more complex than a greenhouse, so the term “Atmospheric Effect” is a more appropriate term.

65
Increased deaths from heat and disease Disruption of food and water supplies Spread of tropical diseases to temperate areas Increased respiratory disease and pollen allergies Increased water pollution from coastal flooding Human Health Rising sea levels Flooding of low-lying islands and coastal cities Flooding of coastal estuaries, wetlands, and coral reefs Beach erosion Disruption of coastal fisheries Contamination of coastal aquifiers with salt water Sea Level and Coastal Areas Changes in forest composition and locations Disappearance of some forests Increased fires from drying Loss of wildlife habitat and species Forests Changes in water supply Decreased water quality Increased drought Increased flooding Water Resources Shifts in food-growing areas Changes in crop yields Increased irrigation demands Increased pests, crop diseases, and weeds in warmer areas Agriculture Extinction of some plant and animal species Loss of habitats Disruption of aquatic life Biodiversity Prolonged heat waves and droughts Increased flooding from more frequent, intense, and heavy rainfall in some areas Weather Extremes Increased deaths More environmental refugees Increased migration Human Population

66
Major urban region at riskIslands at risk Areas at risk from sea level rise.

67
Less severe winters More precipitation in some dry areas Less precipitation in some wet areas Increased food production in some areas Expanded population and range for some plant and animal species adapted to higher temperatures

69
Ultra Fine Particles Fine Particles Large Particles Sea salt nuclei Carbon black Pollens Cement dust Oil smoke Combustion nuclei Metallurgical dust and fumes Photochemical smog Insecticide dusts Coal dust Average particle diameter (micrometers or microns) 0.0010.012.510.0100.0 Tobacco smoke Paint pigments Fly ash Milled flour
 Tobacco smoke Paint pigments Fly ash Milled flour")
71
Example of point source or primary pollution.

72
Primary Pollutants Secondary Pollutants Sources Natural Stationary COCO 2 SO 2 NONO 2 Most hydrocarbons Most suspended particles SO 3 HNO 3 H 2 SO 4 H2O2H2O2 O3O3 PANs MostandsaltsNO 3 – Mobile SO 4 2 –

73
Photochemical reactions

Similar presentations


 and sulphur dioxyde (SO 2 ) in the air Nature.>")
. Increased.>")


