Download presentation
Presentation is loading. Please wait.

1
Elise Miller-Hooks University of Maryland www.millerhooks.umd.edu
Multi-Hazard Resilience Quantification for Civil Infrastructure Systems Elise Miller-Hooks University of Maryland University of Maryland, October 22, 2014

2
Graduate Student Contributors
Graduated Continuing Lisa Chen, Ph.D. Mercedeh TariVerdi Rahul Nair, Ph.D. Ali Asadabadi Hakob Avetisyan, Ph.D. Neza Vodopivec Reza Faturechi, Ph.D. Hossein Fotouhi Xiaodong Zhang, Ph.D. Kevin Denny (UG)
")
3
Two Components of Resilience
Inherent Inherent capability to absorb or cushion effects of disaster via its topological and operational attributes Adaptive Potential cost-effective, immediate actions that can be taken to preserve or restore system’s ability to perform its intended function in disaster’s aftermath

4
3 Applications 3 Concepts
Intermodal Goods Transport (adaptability) Airport Taxiway and Runway Systems (preparedness, adaptability) Drivers – Roadway Travel Time (disaster life cycle)
 Airport Taxiway and Runway Systems (preparedness, adaptability) Drivers – Roadway Travel Time (disaster life cycle)")
5
Application 1: Intermodal Freight Transport
Maximize expected throughput over all scenarios s.t. Total flow along all paths cannot exceed demand Links cannot support flows exceeding capacity Budget constraint on recovery activities Level-of-service constraint At most one recovery action in each link Binary and integrality constraints

6
Solution (P) can be decomposed into a set of independent deterministic programs (P(x)), one for each realization, x Each deterministic program represents an NP-hard problem containing a large number of variables Proof by reduction from knapsack problem Exact solution via Benders decomposition Column generation for subproblem solution Monte Carlo simulation with spatial and temporal dependencies for generating scenarios

7
Port of Świnoujście, Poland
Focus on IM nodal facility High proportion of cargo transit time is spent at nodal facilities Bulk, container terminal and Ro/Ro operations

8
Port of Świnoujście, Poland
Sweden Denmark Rest of Europe ferries cargo ships PORT road and rail Germany (Berlin 140 km) Poland (Poznan 234 km) (Wroclaw 371 km) Czech Rep. (Prague 533 km) Slovakia (Bratislava 783 km)
 Poland. (Poznan 234 km) (Wroclaw 371 km) Czech Rep. (Prague 533 km) Slovakia. (Bratislava 783 km)")
10
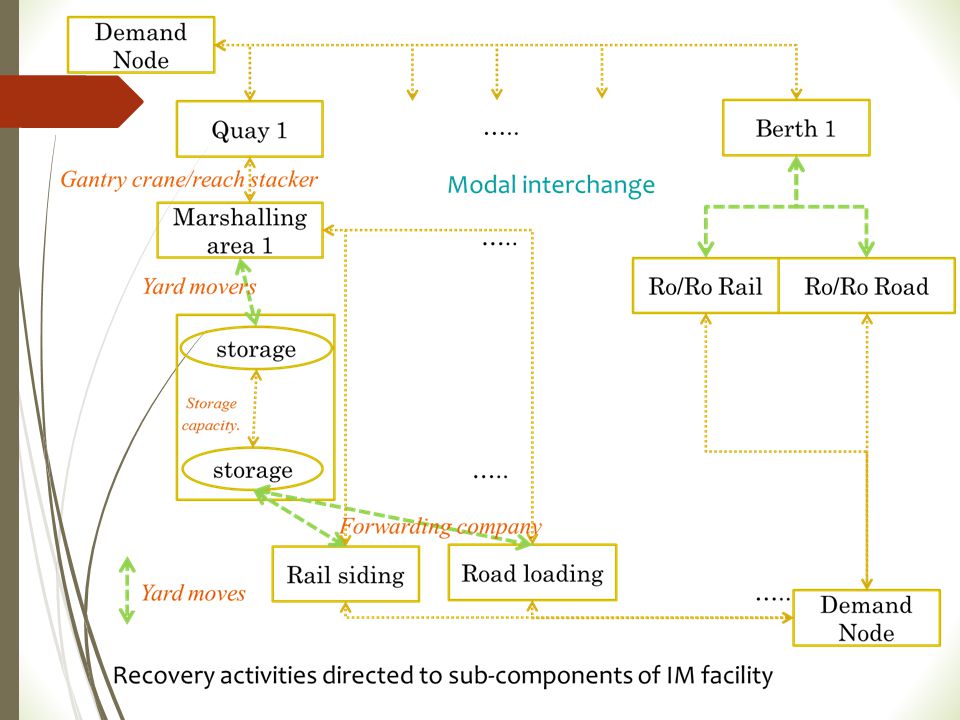
Network Representation
Physical infrastructure & processes Processes = capacitated link

11
-near chemical storage)
Disruption Scenarios Scenario defined by location, intensity, and impact: uncertain Disasters impact processes and reduce link capacities Terrorism (bomb) Terrorism (hinterland access) Terrorism (coordinated/arson -near chemical storage) Earthquake Local Flooding
 Terrorism. (hinterland. access) Terrorism. (coordinated/arson. -near chemical storage) Earthquake. Local Flooding.")
12
Some Details Additional Input Computational Experiments Network
Recovery activities and their impact on various links and processes Cargo flows through port Computational Experiments 10,000 random realizations of disruptions and throughput measured Network 10 O-D pairs 164 arcs, 390 paths 1261 recovery actions Total =$76.6 million Recovery budget $0-$100,000

13
*Port services 77% of flows
Results Increase in resilience due solely to recovery actions Budget ($) Resilience level 77%* 10,000 87% 50,000 97% 100,000 99% *Port services 77% of flows
 Resilience level. 77%* 10, % 50, % 100, % *Port services 77% of flows.")
14
Point Resilience The higher the budget, the narrower the range
Stabilization after ~2k realizations

15
Mitigation & Preparedness
Solution of (P) provides optimal recovery actions to take for monetary/time budgets Can take preparedness steps to facilitate recovery: Network expansion: e.g. add new link Retrofit – harden network components for greater resistance Order spare parts/backup equipment Preposition resources to aid anticipated recovery activities Implement technologies, training Preparedness actions can enhance inherent coping capacity reduce time and cost of recovery actions
 provides optimal recovery actions to take for monetary/time budgets. Can take preparedness steps to facilitate recovery: Network expansion: e.g. add new link. Retrofit – harden network components for greater resistance. Order spare parts/backup equipment. Preposition resources to aid anticipated recovery activities. Implement technologies, training. Preparedness actions can enhance. inherent coping capacity. reduce time and cost of recovery actions.")
16
Maximizing Resilience
First stage: Maximize expected throughput At most one preparedness action in each link, binary d.v. Second stage: Maximize throughput in each scenario Total flow along all paths cannot exceed demand Budget constraint on preparedness and recovery activities Links cannot support flows exceeding capacity Level-of-service constraint At most one recovery action in each link, integer/binary d.v.

17
Application 2: Airport Taxiway & Runway Pavement Networks
Vulnerable to extreme climatic/geological events random operational events natural deterioration human-induced events Major damage types (asphalt/ concrete) cracking disintegration distortion loss of skid resistance - increased surface slipperiness Assess airport readiness to cope with damage
 cracking. disintegration. distortion. loss of skid resistance - increased surface slipperiness. Assess airport readiness to cope with damage.")
18
Airport Resilience Expectation of total flow of all aircraft types and maneuvers Total demand System performance Pre-event performance Adaptive capacity Post-response performance coping capacity Disaster moment Time

19
Airport Capacity Estimation
Runway capacity estimation through capacity envelopes, boundaries of arrival and departure flows for each runway configuration (FAA 2004) Runway configuration g: Modeling parameters Individual runway a’: Flow of maneuver w in runway a’ for configuration g
 Runway configuration g: Modeling parameters. Individual runway a’: Flow of maneuver w in runway a’ for configuration g.")
20
Airport Capacity Estimation
Taxiway capacity estimation piecewise linear envelopes, boundaries of taxiway bi-directional flow (using piecewise linearization of Sherali, 2001) Directional taxiway flows Convex-combination weights Taxiway capacity
 Directional. taxiway flows. Convex-combination weights. Taxiway capacity.")
21
Minimum Operating Strip (MOS) Requirements
Runway segmentation to manage repair actions Shortest set of consecutive functioning runway segments for safe landing and takeoff Landing 1 2 3 4 5 6 7 Takeoff 1 2 3 4 5 6 7

22
MOS Requirements Constraints to capture max functioning runway length given segment damage states and repair actions Post-event damage state 4 3 2 1 Min takeoff length requirement Post-response damage state 4 3 2 1

23
Optimization Model Max. expected total arrival/departure flows over all ξ 1st stage decision # and type of equipment to purchase # of teams to train 2nd stage decision Link/path flows (# of arrival/departure flights) Runway configuration selection Taxiway flow allowed if damage state equal to 1 Landing/takeoff min runway length requirements Taxiway/runway post-repair damage state Max allowed repair time Repair actions with internal or external resources Budgetary limitations Non-negativity and integrality
 Runway configuration selection. Taxiway flow allowed if damage state equal to 1. Landing/takeoff min runway length requirements. Taxiway/runway post-repair damage state. Max allowed repair time. Repair actions with internal or external resources. Budgetary limitations. Non-negativity and integrality.")
24
Envisioned DSS

25
Modeling Input Scenario generation Identification of
repair action types equipment requirements implementation time & costs external repair resources

26
Illustrative Example New York LaGuardia airport (LGA) 22 13 31 04
")
27
Optimization Model Input
Runway configurations

28
Optimization Model Input
Repair equipment list Disruption types & possible consequences

29
Modeling Results Optimal budget allocation on internal/ external resources Probability: runway configuration selection

30
Modeling Results Resilience indifference curves 0.75

31
Application 3: Travel Time Resilience for Roadways
Travel time key in vehicular traffic Challenge: how to model decentralized response of users to disruption? Partial User-Equilibrium

32
Information Evolution in Disaster
Disaster tree captures information evolution corresponding to decisions at each stage of the disaster life cycle

33
Travel Time Resilience Problem TTRP
Bilevel, three-stage, stochastic program with PUE constraints Upper-Level (leader): Uncertainty unfolds Mitigation, preparedness and response actions identified/budgeted Lower-Level (follower): user response to UL decisions shortly after response stage, seeks PUE Extension of stochastic network design problem (SNDP), formulated as SMPEC Uncertainty in both levels Stackelberg equilibrium at optimality
: Uncertainty unfolds. Mitigation, preparedness and response actions identified/budgeted. Lower-Level (follower): user response to UL decisions shortly after response stage, seeks PUE. Extension of stochastic network design problem (SNDP), formulated as SMPEC. Uncertainty in both levels. Stackelberg equilibrium at optimality.")
34
TTRP Formulation Upper-Level: Lower-Level (PUE):
:")
35
Progressive Hedging Algorithm (PHA - Rockefeller and Wets 1991)
Nonanticipativity constraints Address nonlinearities Nonlinear, convex objective Nonconvex constraints TTRP transformed to single-level, 3-stage SMIP KKT conditions PHA Lagrangian decomposition by scenario Global optimality guaranteed Non-anticipativity constraints added to force identical values over 3rd-stage information states

36
Numerical Application
90 multi-hazard scenarios

37
RIPS II: Interdependency and Civil Infrastructure Societal Systems

38
NSF RIPS II: Quantifying Disaster Resilience of Critical Infrastructure-based Societal Systems with Emergent Behavior and Dynamic Interdependencies UMD-JHU-UDel

39
A Civil Infrastructure-based Societal System (CIbSS)
Comprised of interdependent buildings that together serve a community function Is dependent on networks of critical lifelines Family of structures linked by occupancy type, people, policies, information, location, services Dependent on human, organizational, political, transportation and cyber links

40
Lifelines Loss & Component Downtime Assessment Input to System Performance
(S,P)ς single system state Performance
ς. single system state. Performance.")
41
Interpret and model adaptive actions, emerging organizational behaviors, changing policies: dynamic interdependencies

42
Solution Framework

43
Thank you Peer-reviewed journal articles
Nair, R., H. Avetisyan and E. Miller-Hooks (2010). “Resilience of Ports, Terminals and Other Intermodal Components,” Transportation Research Record 2166, Chen, L. and E. Miller-Hooks (2012). “Resilience: An Indicator of Recovery Capability in Intermodal Freight Transport,” Transportation Science 46, Miller-Hooks, E., X. Zhang and R. Faturechi (2012). “Measuring and Maximizing Resilience of Freight Transportation Networks,” Computers and Operations Research 39(7), 1633–1643. Faturechi, R. and E. Miller-Hooks (2014). “Disaster Resilience in Civil Infrastructure Systems: Quantification and Optimization,” Computer-Aided Civil and Infrastructure Engineering Systems 29, Faturechi, R., E. Levenberg and E. Miller-Hooks (2014). “Evaluating and Optimizing Resilience of Airport Pavement Networks,” Computers and Operations Research 43, 335–348. Faturechi, R. and E. Miller-Hooks (2014). “Travel Time Resilience of Roadway Networks under Disaster,” Transportation Research Part B 70, Faturechi, R. and E. Miller-Hooks (in press). “A Comprehensive Review of the Literature on Disaster Performance Analysis of Transportation Systems,” in press in the ASCE Journal of Infrastructure Systems (available on-line). Zhang, X. and E. Miller-Hooks (in press). “Scheduling Short-Term Recovery Activities to Maximize Transportation Network Resilience,” ASCE Journal of Computing in Civil Engineering. Zhang, X., E. Miller-Hooks and K. Denny (in review). “The Role of Network Topology in Resilience of Transportation Systems,” in second round of reviews for publication in Journal of Transport Geography.
. Resilience of Ports, Terminals and Other Intermodal Components, Transportation Research Record 2166, Chen, L. and E. Miller-Hooks (2012). Resilience: An Indicator of Recovery Capability in Intermodal Freight Transport, Transportation Science 46, Miller-Hooks, E., X. Zhang and R. Faturechi (2012). Measuring and Maximizing Resilience of Freight Transportation Networks, Computers and Operations Research 39(7), 1633–1643. Faturechi, R. and E. Miller-Hooks (2014). Disaster Resilience in Civil Infrastructure Systems: Quantification and Optimization, Computer-Aided Civil and Infrastructure Engineering Systems 29, Faturechi, R., E. Levenberg and E. Miller-Hooks (2014). Evaluating and Optimizing Resilience of Airport Pavement Networks, Computers and Operations Research 43, 335–348. Faturechi, R. and E. Miller-Hooks (2014). Travel Time Resilience of Roadway Networks under Disaster, Transportation Research Part B 70, Faturechi, R. and E. Miller-Hooks (in press). A Comprehensive Review of the Literature on Disaster Performance Analysis of Transportation Systems, in press in the ASCE Journal of Infrastructure Systems (available on-line). Zhang, X. and E. Miller-Hooks (in press). Scheduling Short-Term Recovery Activities to Maximize Transportation Network Resilience, ASCE Journal of Computing in Civil Engineering. Zhang, X., E. Miller-Hooks and K. Denny (in review). The Role of Network Topology in Resilience of Transportation Systems, in second round of reviews for publication in Journal of Transport Geography.")
Similar presentations
 D isaster: Basic Terminology.>")


>")


>")


