Download presentation
Presentation is loading. Please wait.

1
Extinction

2
More than 99% of the species that have existed since the Cambrian are now extinct. Hanging on that long is tough to do. There are exceptions. A marine organism (brachiopod) occupying vertical burrows in sand and mud has survived morphologically unchanged since the Silurian.
 occupying vertical burrows in sand and mud has survived morphologically unchanged since the Silurian..")
4
The horseshoe crab, an inhabitant of marine shores, has lived morphologically unchanged since the Ordovician. A horseshoe crab in ventral (underside) view is shown.
 view is shown..")
6
Extinction is the symmetrical partner of speciation…. …and is just as important in determining the nature of life today.

7
We distinguish…. Catastrophic, or mass, extinctions Include the loss of many species from different taxonomic groups occurring relatively abruptly over short period of geologic time. Uniform, or background, extinctions The gradual loss of members of taxonomic groups over long time periods without abrupt loss of large numbers. Most extinctions have been uniform.

8
Why do species go extinct? Often, the answer is unclear. Horses provide an interesting example. Horses evolved in North America and spread to Eurasia and Africa. They went extinct in North America some 15,000 years ago.

9
They were reintroduced about 400 years ago by the conquistadors. How did they do?

10
Pretty well. So, why did they go extinct in the first place? We’re not sure.

11
Uniform Extinctions – what causes them? Coevolutionary interactions can explain some extinctions. Remember the dodo and the Calavaria tree?

12
A similar tight association exists between the Australian koala and the eucalyptus that it feeds on. The disappearance of the eucalyptus would threaten the continued existence of koalas. Clearly, however, extinctions are not always this easily explained.

13
Islands The study of life on islands may also provide some clues. It’s often easier to understand events on islands, since they are typically simpler than those on larger bodies of land.

14
A landmark work published in 1967 helped provide some answers. MacArthur Wilson

15
If the size of an island is plotted against the number of species present on it, a direct relationship usually holds—the more area, the more species. Reptile and amphibian species in the West Indies are plotted here. (Data from MacArthur and Wilson 1967.)
.")
16
Immigration and Extinction on Islands (a) Immigration curve. As colonists fill the island, the rate of arrival of new species drops. (b) Extinction curve. As colonists fill up the island, the rate at which species disappear increases. (After MacArthur and Wilson 1967.)
 Extinction curve. As colonists fill up the island, the rate at which species disappear increases. (After MacArthur and Wilson 1967.).")
17
Where immigration and extinction curves cross, an equilibrium number of species is reached. In this example, there are 10 species on the nearby mainland, making it possible for up to 10 species to be on the island. However, in this example the equilibrium sustainable by the island is 6.

18
Distance and Area Effects on Species Equilibrium (a) Distance effect. If our island (from figure 13.4) were moved farther from the mainland, the equilibrium would shift to the left, settling at 2, and some species would become extinct on the island. (b) Area effect. A large island reaches a higher equilibrium than a small island.
 were moved farther from the mainland, the equilibrium would shift to the left, settling at 2, and some species would become extinct on the island. (b) Area effect. A large island reaches a higher equilibrium than a small island..")
19
It doesn’t have to be an island to be an “island”.

21
Applied island biogeography Principles of island biogeography applied to the management of nature reserves helps make decisions about survival of organisms living in the reserve. In each comparison, design A is superior to B.

22
Some taxonomic or ecological groups have higher rates of extinction than others. Small, herbivorous mammals have lower extinction rates than large, carnivorous ones. Tasmanian “tiger” – now extinct

23
Mathematical models have been developed to use demographic factors to predict the susceptibility of a species to extinction. One thing is clear. When populations become small, the chance of extinction resulting from purely random factors goes up. It appears that the chance of extinction increases non-linearly as population size decreases.

24
Results of a study employing demographic factors to predict time to extinction.

25
Recent extinctions Over the last 200 years, humans have directly or indirectly caused the extinction of thousands of species…. that we know of. Case in point – the passener pigeon (Ectopistes migratorius). Read the discussion on page 216 in your text.
. Read the discussion on page 216 in your text..")
26
Others…. Great auk Carolina parakeet Stellar’s sea cow

27
The American chestnut (Castanea dentata) has been virtually wiped out by an introduced pathogenic fungus (Endothia parasitica) which reached the U.S. accidentally in 1904. The resulting blight destroyed most existing trees, and threatens the species with extinction.

28
The damming of the Chagres River during the building of the Panama Canal led to the formation of Barro Colorado Island. Since the formation of the island, perhaps as many as 50 species of birds have become extinct on the island. It appears that the small populations that were present on the island died out and were not replaced by colonists from the mainland.

29
So, what does island biogeography tell us about extinction? Habitat size is a critical component. Why?

30
And, there’s the Red Queen. The idea came from Leigh van Valen.

31
Given is a family of fossil organisms. To follow declines in numbers over time, we pick a starting point and then follow these species forward in time (thick lines). Starting with 10 species (A–J) in this family, some become extinct, leaving 7, 5, 4, 2, and 1 remaining species on successive time intervals. Below the phylogeny, these numbers are plotted (semilog plot) showing the constant decline through time. Van Valen looked at the fossil record of different groups.
. Starting with 10 species (A–J) in this family, some become extinct, leaving 7, 5, 4, 2, and 1 remaining species on successive time intervals. Below the phylogeny, these numbers are plotted (semilog plot) showing the constant decline through time. Van Valen looked at the fossil record of different groups..")
32
He envisioned an evolutionary “race”, which a species must ultimately lose.

33
Evolutionary Survivorship Curves (a) Protists: foraminifera. (b) Mammals: artiodactyla—deer, elk, and related species. (c) Pteridophyta: ferns and related species. (d) Mammals: perissodactyla—horses and related species. M.Y.: millions of years passed. (After Van Valen 1973.)
 Mammals: artiodactyla—deer, elk, and related species. (c) Pteridophyta: ferns and related species. (d) Mammals: perissodactyla—horses and related species. M.Y.: millions of years passed. (After Van Valen 1973.).")
34
Mass Extinctions

35
Of more than 19,000 genera, 10 samples of 1,000 genera were chosen at random and the percentage becoming extinct was plotted. Major peaks of mass extinction are indicated. How many have there been?

36
Extinction Episodes—Marine Animals Plotted a slightly different way, the standing diversity of marine invertebrate and vertebrate animals is shown. Five abrupt drops in diversity are numbered (1-5). The relative magnitudes of these drops were determined by measuring from the stage before to the stage after the extinction event. These relative magnitudes are given in parenthesis. (After Raup and Sepkoski 1982.)
. The relative magnitudes of these drops were determined by measuring from the stage before to the stage after the extinction event. These relative magnitudes are given in parenthesis. (After Raup and Sepkoski 1982.).")
37
Extinction episodes—marine animals The standing diversity of marine invertebrate and vertebrate animals is shown. Five abrupt drops in diversity can be identified.

38
A reconstruction of the ancient seabed in southern China before and after the Permo-Triassic mass extinction event. One major mass extinction occurred about 250 million years ago at the boundary between the Permian and Triassic Periods. A number of possible causes have been suggested, focusing primarily on periods of global warming or cooling.

39
Extinction Episodes Tetrapods The number of tetrapod families, the standing diversity, is plotted beginning with the first tetrapods in the Devonian. Six mass extinctions are indicated where diversity abruptly drops. Notice that the curve starts sharply upward during the Tertiary—this is a reflection of some increase in diversity, especially among birds and mammals, but also an artifact of the better preservation of fossils as we approach the present. (After Benton 1989.)
.")
40
FIGURE 13.11 Extinction Episodes—Families of Marine Animals The number of marine animals going extinct per million years is plotted. The solid line (regression line) expresses the average—fewer than 8 species extinctions per million years. The parallel dashed lines are the statistical confidence limits that bound the “background” extinction rate. Elevated levels of extinction above background are “mass extinctions,” indicated with the five points (1–5) corresponding to geological time intervals. (After Raup and Sepkoski 1982.)
 expresses the average—fewer than 8 species extinctions per million years. The parallel dashed lines are the statistical confidence limits that bound the background extinction rate. Elevated levels of extinction above background are mass extinctions, indicated with the five points (1–5) corresponding to geological time intervals. (After Raup and Sepkoski 1982.).")
41
Origin and extinction The rise and fall of various groups of animals are shown relative to the geologic time scale. The Permo-Triassic and Cretaceous extinctions are evident.

42
What about the dinosaurs?

43
Extinction of dinosaurs After their demise at the end of the Cretaceous, dinosaurs were replaced as dominant land vertebrates by birds and mammals. [The geologic dates given here are now revised, but provide a relative picture of groups.]

44
Mesozoic Tetrapods-Ancestors and Survivors Together, the Ornithischia* plus the Saurischia* constitute the “dinosaurs.” Notice that birds and mammals are early contemporaries of the dinosaurs.

45
Cosmic collision At the end of the Cretaceous, an asteroid or comet struck the Earth in the location of present day Yucatan Peninsula in Mexico. Although such a collision certainly occurred, it is debated whether or not this collision was directly responsible for the dinosaur extinctions.

47
Gravity map of the Chicxulub crater

48
Luiz and Walter Alvarez at a clay outcrop in Italy. High iridium layers at the K-T boundary led to their hypothesis about an asteroid impact.

49
Is an asteroid impact the only explanation for the demise of the dinosaurs? Perhaps not. Recall that dinosaurs were not typical reptiles. Other possibilities include: 1. Inability to compete with developing mammals. 2. Development of angiosperms.

50
After the dinosaurs Extinction of the dinosaurs left may ecological niches empty. In part, the subsequent flourishing of mammals and birds represents an adaptive radiation into many of these vacated life styles.

51
Another possible cause of extinctions – mingling of species

52
Plate tectonics The crustal surface of the Earth is broken up into plates that abut against each other and move about carrying their continents to every changing positions. Present day plates are shown.

54
Collision zones Movement of the Earth’s crustal plates results in their slow collision with each other. Usually one plate over rides another, as shown here. Note how the ocean basin between them changes in size and depth, thereby changing sea level against the side of the continents.

55
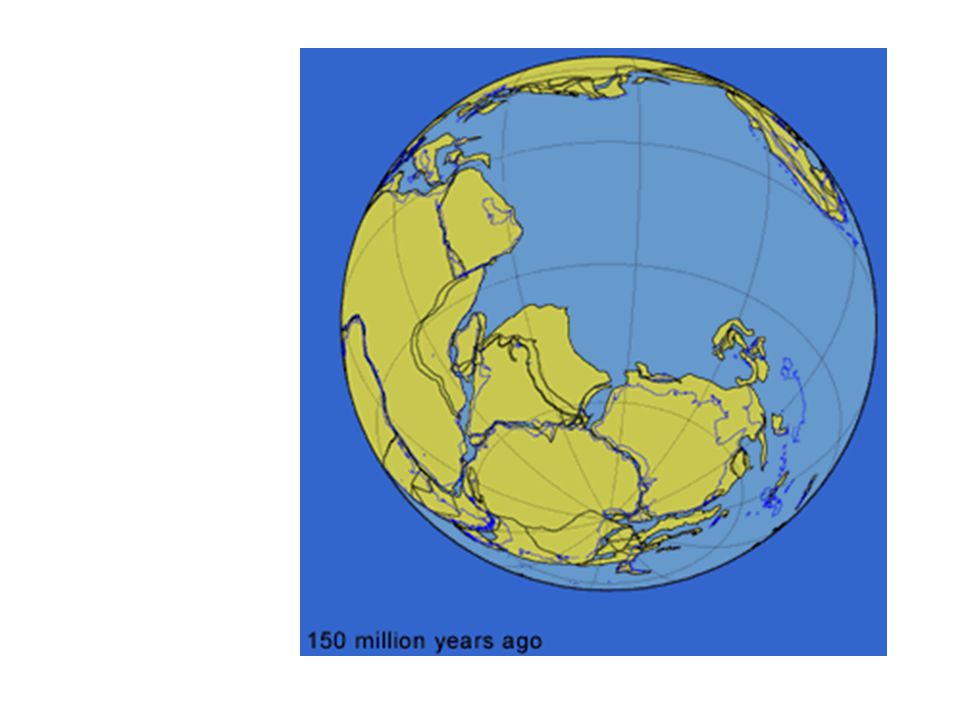
Continents and extinctions At the end of the Permian (Late Paleozoic), the major continents of the world were joined together into a super continent, Pangaea. At the end of the Cretaceous (end of the Mesozoic), the great land mass of Pangaea had begun to break apart into the basic continents we recognize today.
, the great land mass of Pangaea had begun to break apart into the basic continents we recognize today..")
56
FIGURE 13.14 The Great Exchange — North and South America Separate faunas and floras evolved on these continents when they were separate during the Cenozoic. About 2 to 3 million years ago, the Isthmus of Panama formed, providing a land bridge between the continents that became a route of migration and exchange between the continents. Among the placental mammals, many arising in North America dispersed south, and many originating in South America dispersed north.

59
FIGURE 13.15 Continental Drift (a) Pangaea formed at the end of the Permian as the result of previously separate continental landmasses fusing together into this single supercontinent. (b) Continents broke up again at the end of the Cretaceous.
 Continents broke up again at the end of the Cretaceous..")
60
FIGURE 13.16 Perimeter Area When a landmass (a) is broken in two (b), this adds area along the perimeter where they split. This adds to the intertidal area. When two landmasses (b) are brought together (a), this results in loss of available intertidal area.
 are brought together (a), this results in loss of available intertidal area..")
61
FIGURE 13.17 Continental Shelves Because of the sloped geometry of the continents, a drop in sea level along a continental shelf eliminates large areas of intertidal habitat (dark shaded) compared to a similar drop in sea level against a steeply sloped drop-off area (light shaded).
 compared to a similar drop in sea level against a steeply sloped drop-off area (light shaded).")
62
FIGURE 13.18 Sea Level Drop, Permo-Triassic Note that as the sea level dropped (a) at the end of the Permian, there was a corresponding loss of marine animals (b). Sea level is expressed as a percentage of possible coverage, which began falling about 30 to 35 million years ago (solid arrow) before the end of the Permian. Estimates of absolute drop in level range from 300 to 600 feet (100Ð200 m). Tick marks along horizontal axes represent geologic stages of varying duration. (After Schopf, 1974.)
 before the end of the Permian. Estimates of absolute drop in level range from 300 to 600 feet (100Ð200 m). Tick marks along horizontal axes represent geologic stages of varying duration. (After Schopf, 1974.).")
63
FIGURE 13.19 Phanerozoic Extinctions and Ice Ages Ice ages are indicated along this geologic time line for comparison to five mass extinction episodes. Note that there is no tight correlation between ice ages and mass extinctions.

66
Some species have shown a remarkable ability to come back from the brink of extinction. The northern elephant seal (Mirouga angustirostris) and the sea otter (Enhydra lutris) were both hunted to near extinction in the early part of the 20 th Century. Once protected, both have recovered to large, healthy populations. The gray whale (Eschrichtius robustus) is also recovering under protection. A number of bird species (sandhill cranes, trumpeter swans, snowy egrets, and others) have also made significant recoveries.
 and the sea otter (Enhydra lutris) were both hunted to near extinction in the early part of the 20 th Century. Once protected, both have recovered to large, healthy populations. The gray whale (Eschrichtius robustus) is also recovering under protection. A number of bird species (sandhill cranes, trumpeter swans, snowy egrets, and others) have also made significant recoveries..")
67
Extinction in the Fossil Record In some cases, the fossil record is complete enough to show that many species became extinct over a relatively short time period. These events have come to be known as mass extinctions. They apparently result from some drastic, widespeard environmental change.

68
The six largest mass extinctions have been particularly significant. Not only did they eliminate large portions of the existing biological diversity. They also seem to have been precursors to significant adapative radiations as organisms rapidly filled the newly available niches.

69
One of the most recent extinction events was the disappearance of the Pleistocene “megafauna” (primarily large mammals, between ~ 15,000 and ~ 8,000 years ago. This led to the disappearance of a large number of mammalian species, particularly in North America.

70
A variety of causes have been suggested. A number of lines of evidence are now suggesting that humans may have played a large role.

Similar presentations


 The empirical model,>")


>")


