Download presentation
1
Illuminating the Fine Print: Visualizing Medication Side-Effects in Complex Multi-drug Regimens Jon D. Duke, MD NLM Medical Informatics Fellow Regenstrief Institute Indiana University

2
The QuARK Project Quantitative Adverse Reaction Knowledgebase

3
The Tao of QuARK The Concept Building the Knowledgebase Clinical Applications Testing the Model Future Directions and Research QuARK: Quantitative Adverse Reactions Knowledgebase

4
Part I: The Concept

5
The primary goal of QuARK is to simplify the process of assessing adverse drug reactions in patients taking multiple medications. QuARK: What is it good for? QuARK: Quantitative Adverse Reactions Knowledgebase

6
Polypharmacy

7
Kaufman DW, Kelly JP, Rosenberg L, Anderson TE, Mitchell AA. Recent patterns of medication use in the ambulatory adult population of the United States: the Slone survey. JAMA 2002;287: 337-44.

8
Polypharmacy Has increased significantly over past 20 years Increases risk for adverse drug reactions Known risk factor for overall morbidity and mortality Estimated cost $76B annually 1. Hajjar ER, Cafiero AC, Hanlon JT. Polypharmacy in elderly patients. Am J Geriatr Pharmacother 2007;5: 345-51. 2. Nguyen JK, Fouts MM, Kotabe SE, Lo E. Polypharmacy as a risk factor for adverse drug reactions in geriatric nursing home residents. Am J Geriatr Pharmacother 2006;4: 36-41. 3. Tam-McDevitt J. Polypharmacy, Aging, and Cancer: Growing Risks. Oncology 2008;9. 1 2 1 3

9
Side-Effect Complexity

10
Number of Drugs SE Complexity X Physician Time = The Problem

11
Side-Effects Interactions

12
Current Solutions

13
Goals Look up multiple medications simultaneously Rapidly get to side-effect of interest Show the relative strength of association between a drug and its side-effects Well-integrated into clinical workflow

14
Origins of QuARK

15
Hmmmmm…. Zocor Metformin Norvasc Lisinoprol/HCTZ Azithromycin NauseaDizzinessEdemaFatigueCoughPalpitations

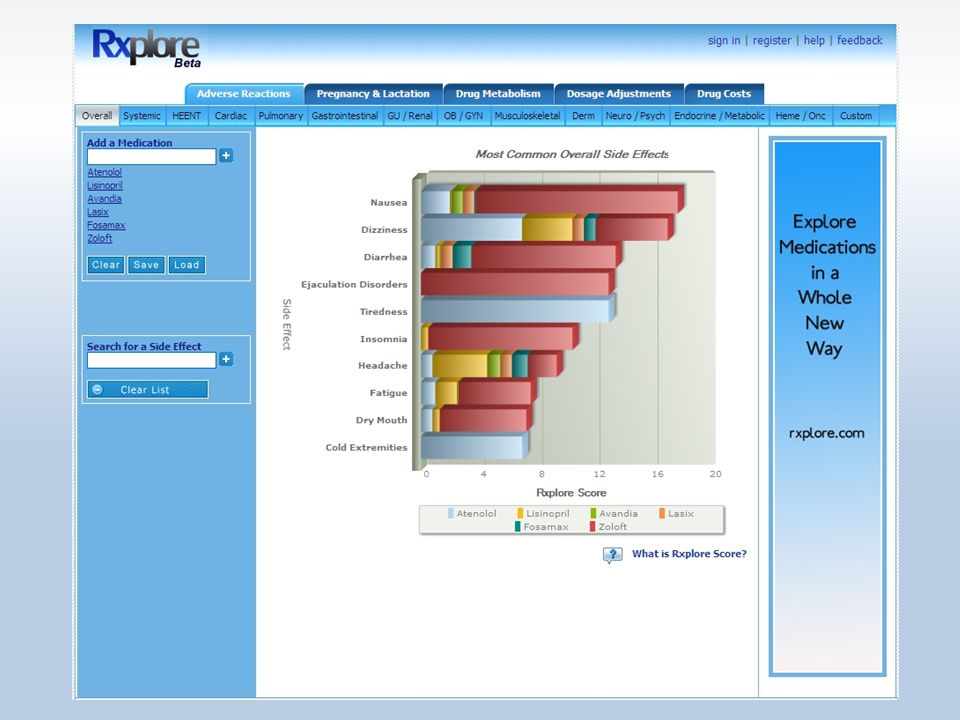
16
Part II: Building the Knowledgebase

17
Which Medications to Include? By prescribing volume By formulary QuARK Wishard Top 500 Clarian Top 500 U.S. Top 300

18
Coding the Medications RxNorm UNI NDC Regenstrief Dictionary QuARK RI Dictionary RxNorm

19
Sources of Adverse Reaction Data FDA Label MedWatch / AERS Clinical Repository (eg. RMRS) Social Networks (eg. patientslikeme.com) QuARK FDA Label
 Social Networks (eg. patientslikeme.com) QuARK FDA Label.")
20
Coding the Side-Effects MedDRA CTCAE SNOMED-CT ICD-9 UMLS CUI QuARK MedDRA UMLS CUI SNOMED-CT

21
Which Side-Effects to Include? Must select a single unique representation of each medication / side-effect pair

22
Which Side-Effect Data to Include? Which treatment indication? Which dose? Which trial duration? Pre- / Post-marketing data? QuARK Most common indication preferred Aggregate dose data preferred, otherwise most common dose Larger trials with longer duration preferred If duplicate data: Post-marketing data included if not present in trials

23
Side-Effect Quantification The assignment of a numeric score to represent the relative frequency at which a particular medication causes a particular side-effect.

24
Types of Frequency Data Drug vs Placebo – 34% of Neurontin patients experienced nausea vs 12% of placebo patients Frequency Range – Between 3% and 9% of patients taking Lipitor experienced dizziness Qualitative Frequency Descriptor – Diarrhea occurred infrequently in patients taking Lisinopril Statement of Occurrence – Thrombocytopenia was reported in patients taking Norvasc.

25
Drug vs Placebo Optimal data format Applied “Absolute Risk Reduction” approach (ie. treatment incidence – placebo incidence) ex. Score = 34 - 12 = 22 Database would include both the original raw data in addition to the calculated score QuARK Drug vs Placebo Score = Treatment Incidence - Placebo Incidence eg. 34% of Neurontin pts experienced nausea vs 12% of placebo pts
 ex. Score = = 22 Database would include both the original raw data in addition to the calculated score QuARK Drug vs Placebo Score = Treatment Incidence - Placebo Incidence eg. 34% of Neurontin pts experienced nausea vs 12% of placebo pts.")
26
Frequency Range No placebo data given Study size and duration not available Patient population unknown Conservative score calculation: Score = x+(y-x)/3 = 3+(9-3)/3 = 5 Original data range preserved in database QuARK eg. Between 3% and 9% of Lipitor patients experienced dizziness Frequency Range Scoring Between X% and Y% of patients taking {drug} experienced {effect} Score = X+(Y-X)/3
/3.")
27
Qualitative Frequency Descriptor No placebo or population data Wide range of terms used (eg. rarely, occasionally, often) Quantitative mappings may be provided (Rarely = “< 1/100”) Where mappings unavailable, conservative scores assigned based on interpretation of terms (sometimes = occasionally > infrequently) QuARK eg. Diarrhea occurred infrequently in patients taking Lisinopril Qualitative Scoring Occasionally 0.75 Infrequently 0.5 Rarely 0.3
 Quantitative mappings may be provided (Rarely = < 1/100 ) Where mappings unavailable, conservative scores assigned based on interpretation of terms (sometimes = occasionally > infrequently) QuARK eg. Diarrhea occurred infrequently in patients taking Lisinopril Qualitative Scoring Occasionally 0.75 Infrequently 0.5 Rarely 0.3.")
28
Statement of Occurrence No frequency information No placebo or population data Commonly seen with post- marketing reports or class effects Conservative scoring applied “Post-Marketing” status noted in database QuARK eg. Thrombocytopenia was reported in patients taking Norvasc. Occurrence Scoring Occurs in drug 0.8 Occurs in class 0.7 Occurs more often in placebo 0.1

30
QuARK Part III: Applications

31
Rxplore Interactive visualization of QuARK data Allows quick retrieval of most common side- effects of complex drug regimens Highlights potential causal agents in the setting of an adverse drug event Allows “virtual swapping” of a medication to assess impact on patient’s side-effect profile

33
QuARK & Gopher Goal: Allow QuARK visualizations to be retrieved directly from Gopher order entry Created prototype running on Gopher Dev Auto-populates medication list directly from Gopher patient chart

36
QuARK Bubble Map

37
Medication Heat Map Adverse Effects by Organ System Dizziness 24% vs 3% Headache 11% vs 2% Insomnia 6% vs 3% Highly Affected Minimally Affected Diazepam

38
QuARK & Clinical Reminders Chief Complaint-driven Trigger Event-driven

39
QuARK & Clinical Reminders Chief Complaint-driven – Which of a patient’s medications are associated with the Chief Complaint? – At what frequency? “ The patient’s complaint of Dizziness has been associated with use of: Gabapentin (28% vs. 7% Placebo) Atenolol (13% vs 6% Placebo) Omeprazole (Less than 1%) ”
 Atenolol (13% vs 6% Placebo) Omeprazole (Less than 1%) .")
40
QuARK & Clinical Reminders Trigger Event-driven – Laboratory / EKG change generates reminder – Offers suggestions for possible causal agents “ Neutropenia (WBC 1.4 10/22/08) has been associated with use of: Valsartan (1.9% vs 0.8% placebo) Amiodarone (Has been reported) Lisinopril (Occurs rarely) ”
 has been associated with use of: Valsartan (1.9% vs 0.8% placebo) Amiodarone (Has been reported) Lisinopril (Occurs rarely)")
41
QuARK Part IV: Testing the Model

42
Garbage In / Garbage Out? Limitations of the Data Algorithmic Considerations Does a Gold Standard exist? An Approach to Validation

43
Comparison with AERS Adverse Event Reporting System Captures over 400,000 reports a year Allows for listing of multiple medications Records Adverse Reaction and Suspected Cause Subset includes “Dechallenge” Data

44
QuARK vs AERS Dechallenge data from 2008 Q2 Evaluated reports of four common reactions (nausea, edema, insomnia, hyponatremia ) Limited to cases where patient was taking at least 5 medications Compared the QuARK “suspected drug” with actual reported cause
 Limited to cases where patient was taking at least 5 medications Compared the QuARK suspected drug with actual reported cause")
45
% Accuracy Reported Adverse Reaction Accuracy of QuARK Ranking for AERS Reports Q2 2008 n=31 n=21n=14n=25

46
Sources of Error <10% missed cases due to algorithm error >90% missed cases due to complete absence of the adverse reaction from the drug label Delays in drug label updating Reflects nature of adverse event reporting – Known side-effects often not reported – New drug mandatory reporting predominates AERS

47
QuARK Part V: Future Directions and Research

48
Evaluation Studies Laboratory study of “decision velocity” Survey of User Satisfaction / Efficiency

49
Clinical Reminder Study Generate QuARK-based reminders for laboratory triggers (eg. LFT’s) Intervention group receives reminder noting potential causal agents / frequency data Compare drug discontinuation rates as well as time between trigger and discontinuation
 Intervention group receives reminder noting potential causal agents / frequency data Compare drug discontinuation rates as well as time between trigger and discontinuation.")
50
Build a Better QuARK Additional medications Expansion of AERS-QuARK analysis Optimization of scoring algorithm Additional visualization methods Potential use in consumer health

51
Summary QuARK is a knowledgebase containing quantitative frequency data for adverse drug reactions Potential applications include: – visualization of side-effect data – simplified lookup of multidrug regimens – clinical reminders targeted at adverse drug events Opportunities for research collaboration

52
Thanks! NLM, Steve Downs, Mike McCoy, Marc Overhage, Shaun Grannis, Gunther Schadow, Siu Hui, Martin Were, Marc Rosenmann, Linas Simonatis, Atif Zafar, Paul Dexter, Mike Weiner, Paul Biondich, Burke Mamlin, Anne Belsito Pop the QuARK!


, and the other of people with the same general characteristics.>")


 (Subtitle of Presentation) August 8, 2007 Hematologic Cancers Partners Meeting Centers for Disease Control and Prevention May 16,>")


