Download presentation
Presentation is loading. Please wait.

1
FINAL REVIEW Landing Gear JTP Wear Test Analyses J.D. Schell GE Aircraft Engines 8-28-2001 2 HCAT Toronto Meeting Crowne Plaza Hotel August 28-30, 2001

2
Wear Test Schematics Rod and Bushing wear test.Fretting wear test. Unctd Part (BBS):Block/Seal Bushing/Seal Coated Part (RS) : Shoe Rod
:Block/Seal Bushing/Seal Coated Part (RS) : Shoe Rod.")
4
Bushing Rod

5
Test Matrix Coatings vs Metal Bushings 4340 steel rods 9”x1” –EHC coated, SWA (MIL-STD-1501C, QQ-C-320B) –WC-17Co (Diam 2005) –WC-10Co-4Cr (SM5847) –HVOF by DJ2600 at Ch Pt –All ground to 8 Ra ( -in) Bushings, 64 Ra max –4340 steel, 260-280 UTS –AMS 4640, Al Ni Bronze –Anodized 2024 Al, SWA (MIL-A-8625, Type 3, Class I) Coatings vs Seals Nitrile Rubber Seals –Grooved 4340 bushing –7214-FT-160-T from Green Tweed (MIL-HDBK-695C) Karon B liner in Al bronze bushing, 0.015” thick layer –Kamatics Corp. –Filled phenolic compound

6
Test Matrix (cont.)
")
8
Wear Measurement Accuracy Wear Volumes from delta weight Vol = Wgt/density Densities of test matls (gm/cc) EHC = 7.2 4340 =7.83 nitrile=1.27 WC-17Co=12.2 AlNiBR=7.12 Karon B=1.51 WC-Co,Cr=13.6 anodized Al = 3.16 (up to ~3.6 max)
 EHC = =7.83 nitrile=1.27 WC-17Co=12.2 AlNiBR=7.12 Karon B=1.51 WC-Co,Cr=13.6 anodized Al = 3.16 (up to ~3.6 max)")
9
Wear Measurement (cont.) Cleanliness of specimens was an on-going source of error –isolated early occasions where heavy oil and grit in threaded and center point vee were found gave up to 0.15 gm error in weight –improved, but still easily up to 0.01 gm error when missed Due to cleanliness issues, a second method of wear assessment based on visual ratings was developed and used in addition to wgts
 Cleanliness of specimens was an on-going source of error –isolated early occasions where heavy oil and grit in threaded and center point vee were found gave up to 0.15 gm error in weight –improved, but still easily up to 0.01 gm error when missed Due to cleanliness issues, a second method of wear assessment based on visual ratings was developed and used in addition to wgts")
10
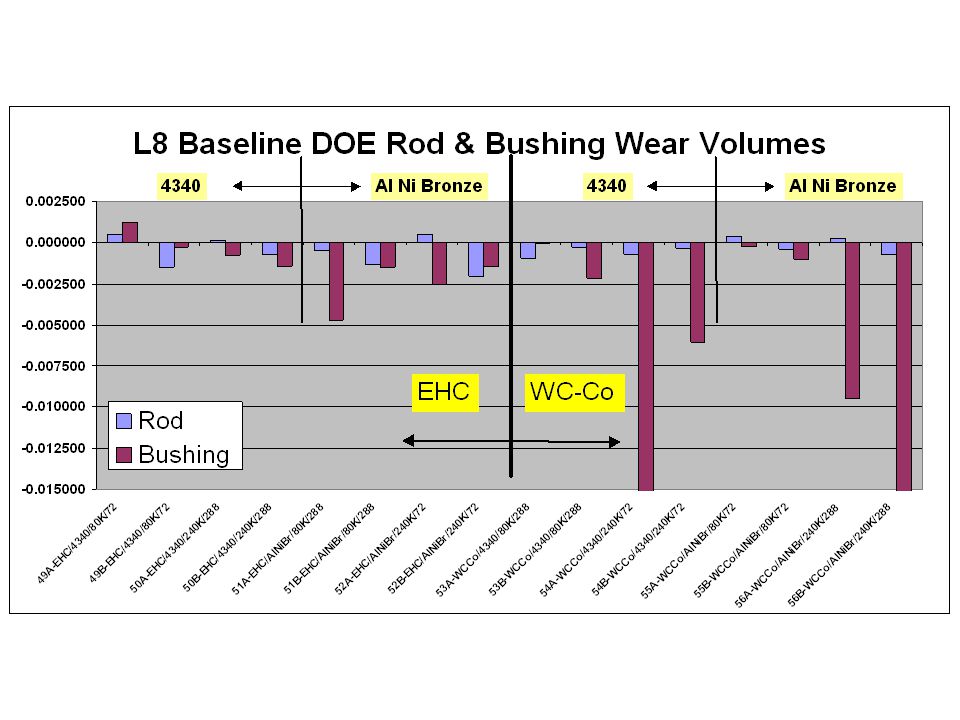
Statistical Model Wear Results for 4340 Bushings Max Measurement Error When Poor Cleaning Occurred Measurement Precision (X3)
")
11
Visual Appearance of Coated Rods All tested rods visually rated from 1-10 Initial L12 DOE specimens showed wide range of wear scar appeances. Picked least damaged as a 1 and worst damaged as a 10. Selected others as 2, 3, 6, 7, and 8 and adopted these as photostandards for rating rods. All rods laid out and compared side by side with the original rods of the standards (not to photos which follow)
.")
13
VR 2

14
VR 3

15
VR 7

16
VR10

17
Chrome and WC-Co

19
Coatings vs Metal Bushing Summary (Avgs of Orthogonal Arrays) = Data believed to be heavily influenced by measurement errors
 = Data believed to be heavily influenced by measurement errors")
21
Statistical Model Wear Results for 4340 Bushings Max Measurement Error When Poor Cleaning Occurred Measurement Precision (X3)
")
24
Statistical Model Wear Results for NiAl Bronze Bushings

25
Fractional Factorial Fit with Chrome & WC-Co Coatings Estimated Effects and Coefficients for Rod Coating Wear (coded units) Term Effect Coef StDev Coef T P Constant -0.000495 0.000235 -2.10 0.068 A 0.000037 0.000019 0.000235 0.08 0.939 B -0.000037 -0.000018 0.000235 -0.08 0.940 C-Ctg 0.000219 0.000109 0.000235 0.47 0.654 D -0.000045 -0.000023 0.000235 -0.10 0.925 A*B -0.000094 -0.000047 0.000235 -0.20 0.847 A*C -0.000095 -0.000047 0.000235 -0.20 0.845 A*D 0.000422 0.000211 0.000235 0.90 0.396 Analysis of Variance for Rod (coded units) Source DF Seq SS Adj SS Adj MS F P Main Effects 4 0.00000021 0.00000021 0.00000005 0.06 0.992 2-Way Interactions 3 0.00000078 0.00000078 0.00000026 0.30 0.828 Residual Error 8 0.00000707 0.00000707 0.00000088 Pure Error 8 0.00000707 0.00000707 0.00000088 Total 15 0.00000806 Rod Ctg Wear for L8 Baseline: Cr, WC-Co Differences in wear results are not statistically significant
 Term Effect Coef StDev Coef T P Constant A B C-Ctg D A*B A*C A*D Analysis of Variance for Rod (coded units) Source DF Seq SS Adj SS Adj MS F P Main Effects Way Interactions Residual Error Pure Error Total Rod Ctg Wear for L8 Baseline: Cr, WC-Co Differences in wear results are not statistically significant")
26
Fractional Factorial Fit LG L8 1st Half Rep: Cr & WC-Co-Cr Ctgs Estimated Effects and Coefficients for Rod Ctg Wear (coded units) Term Effect Coef StDev Coef T P Constant -0.001419 0.000530 -2.68 0.028 A 0.000857 0.000428 0.000530 0.81 0.442 B -0.000377 -0.000189 0.000530 -0.36 0.731 C-Ctg -0.001621 -0.000810 0.000530 -1.53 0.165 D -0.000004 -0.000002 0.000530 -0.00 0.997 A*B -0.000062 -0.000031 0.000530 -0.06 0.955 A*C 0.000712 0.000356 0.000530 0.67 0.521 A*D 0.000068 0.000034 0.000530 0.06 0.950 Analysis of Variance for Rod (coded units) Source DF Seq SS Adj SS Adj MS F P Main Effects 4 0.00001401 0.00001401 0.00000350 0.78 0.568 2-Way Interactions 3 0.00000206 0.00000206 0.00000069 0.15 0.925 Residual Error 8 0.00003592 0.00003592 0.00000449 Pure Error 8 0.00003592 0.00003592 0.00000449 Total 15 0.00005200 Ctg Wear for L8 1st Half Rep: Cr, WC-Co-Cr: Differences in wear results are not statistically significant
 Term Effect Coef StDev Coef T P Constant A B C-Ctg D A*B A*C A*D Analysis of Variance for Rod (coded units) Source DF Seq SS Adj SS Adj MS F P Main Effects Way Interactions Residual Error Pure Error Total Ctg Wear for L8 1st Half Rep: Cr, WC-Co-Cr: Differences in wear results are not statistically significant")
27
Bushing Wear with L8 Baseline: Cr,WC-Co: Differences in wear results are not statistically significant Estimated Effects and Coefficients for Bushing Wear (coded units) Term Effect Coef StDev Coef T P Constant -0.005305 0.001872 -2.83 0.022 A -0.008400 -0.004200 0.001872 -2.24 0.055 B 0.000125 0.000062 0.001872 0.03 0.974 C -0.007712 -0.003856 0.001872 -2.06 0.073 D 0.000341 0.000170 0.001872 0.09 0.930 A*B 0.001658 0.000829 0.001872 0.44 0.670 A*C -0.008178 -0.004089 0.001872 -2.18 0.060 A*D 0.002326 0.001163 0.001872 0.62 0.552 Analysis of Variance for Bushing (coded units) Source DF Seq SS Adj SS Adj MS F P Main Effects 4 0.00052065 0.00052065 0.00013016 2.32 0.144 2-Way Interactions 3 0.00030014 0.00030014 0.00010005 1.78 0.228 Residual Error 8 0.00044848 0.00044848 0.00005606 Pure Error 8 0.00044848 0.00044848 0.00005606 Total 15 0.00126928 Ctg
 Term Effect Coef StDev Coef T P Constant A B C D A*B A*C A*D Analysis of Variance for Bushing (coded units) Source DF Seq SS Adj SS Adj MS F P Main Effects Way Interactions Residual Error Pure Error Total Ctg")
28
Bushing Wear with L8 1st Half Rep: Cr,WC-Co-Cr Differences in wear results are not statistically significant Estimated Effects and Coefficients for Bushing Wear (coded units) Term Effect Coef StDev Coef T P Constant -0.005136 0.002698 -1.90 0.093 A 0.003441 0.001721 0.002698 0.64 0.541 B 0.000742 0.000371 0.002698 0.14 0.894 C Rod -0.007399 -0.003699 0.002698 -1.37 0.207 D Load -0.007929 -0.003965 0.002698 -1.47 0.180 A*B -0.006588 -0.003294 0.002698 -1.22 0.257 A*C 0.003687 0.001844 0.002698 0.68 0.514 A*D 0.002968 0.001484 0.002698 0.55 0.597 Analysis of Variance for Bushing (coded units) Source DF Seq SS Adj SS Adj MS F P Main Effects 4 0.0005200 0.0005200 0.00013001 1.12 0.413 2-Way Interactions 3 0.0002632 0.0002632 0.00008773 0.75 0.551 Residual Error 8 0.0009315 0.0009315 0.00011644 Pure Error 8 0.0009315 0.0009315 0.00011644 Total 15 0.0017147
 Term Effect Coef StDev Coef T P Constant A B C Rod D Load A*B A*C A*D Analysis of Variance for Bushing (coded units) Source DF Seq SS Adj SS Adj MS F P Main Effects Way Interactions Residual Error Pure Error Total")
29
Statistical Model Wear Results

30
Ctg Wear with L8 2nd Half Rep: Cr,WC-Co (4340,Al anodize bushings) Differences in wear results are not statistically significant Estimated Effects and Coefficients for ROD Ctg (coded units) Term Effect Coef StDev Coef T P Constant -0.000479 0.000177 -2.70 0.027 A 0.000176 0.000088 0.000177 0.50 0.633 B -0.000035 -0.000017 0.000177 -0.10 0.924 C-Ctg 0.000142 0.000071 0.000177 0.40 0.699 D 0.000054 0.000027 0.000177 0.15 0.882 A*B 0.000052 0.000026 0.000177 0.15 0.887 A*C 0.000012 0.000006 0.000177 0.04 0.973 A*D 0.000375 0.000188 0.000177 1.06 0.321 Analysis of Variance for ROD (coded units) Source DF Seq SS Adj SS Adj MS F P Main Effects 4 0.00000022 0.00000022 0.00000006 0.11 0.976 2-Way Interactions 3 0.00000057 0.00000057 0.00000019 0.38 0.770 Residual Error 8 0.00000402 0.00000402 0.00000050 Pure Error 8 0.00000402 0.00000402 0.00000050 Total 15 0.00000482
 Differences in wear results are not statistically significant Estimated Effects and Coefficients for ROD Ctg (coded units) Term Effect Coef StDev Coef T P Constant A B C-Ctg D A*B A*C A*D Analysis of Variance for ROD (coded units) Source DF Seq SS Adj SS Adj MS F P Main Effects Way Interactions Residual Error Pure Error Total")
31
Bushing Wear with L8 2nd Half Rep: 4340,Al anodize Differences in wear results are not statistically significant Estimated Effects and Coefficients for BUSHING Wear (coded units) Term Effect Coef StDev Coef T P Constant -0.002698 0.001731 -1.56 0.158 A -0.004990 -0.002495 0.001731 -1.44 0.188 BUSHING 0.005314 0.002657 0.001731 1.53 0.163 C -0.004918 -0.002459 0.001731 -1.42 0.193 D 0.004202 0.002101 0.001731 1.21 0.260 A*B 0.005092 0.002546 0.001731 1.47 0.180 A*C -0.004292 -0.002146 0.001731 -1.24 0.250 A*D 0.005145 0.002572 0.001731 1.49 0.176 Analysis of Variance for BUSHING (coded units) Source DF Seq SS Adj SS Adj MS F P Main Effects 4 0.00037989 0.00037989 0.00009497 1.98 0.191 2-Way Interactions 3 0.00028328 0.00028328 0.00009443 1.97 0.197 Residual Error 8 0.00038364 0.00038364 0.00004796 Pure Error 8 0.00038364 0.00038364 0.00004796 Total 15 0.00104681
 Term Effect Coef StDev Coef T P Constant A BUSHING C D A*B A*C A*D Analysis of Variance for BUSHING (coded units) Source DF Seq SS Adj SS Adj MS F P Main Effects Way Interactions Residual Error Pure Error Total")
32
Coating vs Seals Summary (Avgs of Orthogonal Arrays)
")
34
Statistical Model Wear Results for Nitrile Seals in 4340 Bushings

35
Estimated Effects and Coefficients for ROD CTG Wear (coded units) Term Effect Coef StDev Coef T P Constant -0.006091 0.005873 -1.04 0.330 A 0.012035 0.006017 0.005873 1.02 0.336 B -0.011212 -0.005606 0.005873 -0.95 0.368 C 0.012282 0.006141 0.005873 1.05 0.326 D -0.011080 -0.005540 0.005873 -0.94 0.373 A*B 0.011895 0.005947 0.005873 1.01 0.341 A*C -0.011135 -0.005568 0.005873 -0.95 0.371 A*D 0.012467 0.006234 0.005873 1.06 0.319 Analysis of Variance for ROD (coded units) Source DF Seq SS Adj SS Adj MS F P Main Effects 4 0.002177 0.002177 0.0005442 0.99 0.467 2-Way Interactions 3 0.001684 0.001684 0.0005612 1.02 0.434 Residual Error 8 0.004415 0.004415 0.0005518 Pure Error 8 0.004415 0.004415 0.0005518 Total 15 0.008275 Ctg Wear for L8 3rd Half Rep: Cr, WC-Co Differences in wear results are not statistically significant
 Term Effect Coef StDev Coef T P Constant A B C D A*B A*C A*D Analysis of Variance for ROD (coded units) Source DF Seq SS Adj SS Adj MS F P Main Effects Way Interactions Residual Error Pure Error Total Ctg Wear for L8 3rd Half Rep: Cr, WC-Co Differences in wear results are not statistically significant")
36
Ctg Wear for L8 6th Half Rep: Cr,WCCoCr Differences in wear results are not statistically significant Estimated Effects and Coefficients for ROD Ctg Wear (coded units) Term Effect Coef StDev Coef T P Constant -0.000748 0.000299 -2.50 0.037 A 0.000334 0.000167 0.000299 0.56 0.591 B 0.000066 0.000033 0.000299 0.11 0.915 C -0.000531 -0.000266 0.000299 -0.89 0.400 D -0.000434 -0.000217 0.000299 -0.73 0.489 A*B 0.000861 0.000431 0.000299 1.44 0.187 A*C 0.000179 0.000090 0.000299 0.30 0.771 A*D -0.000429 -0.000214 0.000299 -0.72 0.493 Analysis of Variance for ROD (coded units) Source DF Seq SS Adj SS Adj MS F P Main Effects 4 0.00000235 0.00000235 0.00000059 0.41 0.796 2-Way Interactions 3 0.00000383 0.00000383 0.00000128 0.89 0.485 Residual Error 8 0.00001142 0.00001142 0.00000143 Pure Error 8 0.00001142 0.00001142 0.00000143 Total 15 0.00001759
 Term Effect Coef StDev Coef T P Constant A B C D A*B A*C A*D Analysis of Variance for ROD (coded units) Source DF Seq SS Adj SS Adj MS F P Main Effects Way Interactions Residual Error Pure Error Total")
37
Nitrile Wear for L8 3rd Half Rep: Cr,WC-Co Differences in wear results ARE statistically significant Estimated Effects and Coefficients for Bushing+Seal (coded units) Term Effect Coef StDev Coef T P Constant -0.09341 0.01480 -6.31 0.000 A -0.09012 -0.04506 0.01480 -3.04 0.016 B CTG -0.17611 -0.08805 0.01480 -5.95 0.000 C Seal 0.09678 0.04839 0.01480 3.27 0.011 D Load 0.12011 0.06005 0.01480 4.06 0.004 A*B -0.08003 -0.04002 0.01480 -2.70 0.027 A*C 0.11162 0.05581 0.01480 3.77 0.005 A*D 0.10685 0.05342 0.01480 3.61 0.007 Analysis of Variance for Bush+Seal (coded units) Source DF Seq SS Adj SS Adj MS F P Main Effects 4 0.25171 0.25171 0.062928 17.94 0.000 2-Way Interactions 3 0.12112 0.12112 0.040373 11.51 0.003 Residual Error 8 0.02806 0.02806 0.003507 Pure Error 8 0.02806 0.02806 0.003507 Total 15 0.40088
 Term Effect Coef StDev Coef T P Constant A B CTG C Seal D Load A*B A*C A*D Analysis of Variance for Bush+Seal (coded units) Source DF Seq SS Adj SS Adj MS F P Main Effects Way Interactions Residual Error Pure Error Total")
38
Nitrile Wear for L8 6th Rep: Cr,WC-Co-Cr Differences in wear results are not statistically significant Estimated Effects and Coefficients for Bushing+Seal Wear (coded units) Term Effect Coef StDev Coef T P Constant -0.07231 0.02507 -2.88 0.020 A -0.01612 -0.00806 0.02507 -0.32 0.756 B -0.04219 -0.02110 0.02507 -0.84 0.425 C Seal 0.13139 0.06569 0.02507 2.62 0.031 D -0.01512 -0.00756 0.02507 -0.30 0.771 A*B 0.02540 0.01270 0.02507 0.51 0.626 A*C 0.02749 0.01375 0.02507 0.55 0.598 A*D 0.03405 0.01703 0.02507 0.68 0.516 Analysis of Variance for Bush+Sea (coded units) Source DF Seq SS Adj SS Adj MS F P Main Effects 4 0.078128 0.0781284 0.019532 1.94 0.197 2-Way Interactions 3 0.010242 0.0102415 0.003414 0.34 0.798 Residual Error 8 0.080458 0.0804585 0.010057 Pure Error 8 0.080458 0.0804585 0.010057 Total 15 0.168828
 Term Effect Coef StDev Coef T P Constant A B C Seal D A*B A*C A*D Analysis of Variance for Bush+Sea (coded units) Source DF Seq SS Adj SS Adj MS F P Main Effects Way Interactions Residual Error Pure Error Total")
39
Ctg Wear for L8 4th Rep: Cr,WC-Co (4340 and Karon B Bushings) Differences in wear results are not statistically significant Estimated Effects and Coefficients for BUSHING (coded units) Term Effect Coef StDev Coef T P Constant -0.001637 0.002061 -0.79 0.450 A -0.005106 -0.002553 0.002061 -1.24 0.251 B Ctg 0.007436 0.003718 0.002061 1.80 0.109 C Seal -0.007507 -0.003753 0.002061 -1.82 0.106 D 0.003680 0.001840 0.002061 0.89 0.398 A*B 0.004975 0.002488 0.002061 1.21 0.262 A*C -0.004814 -0.002407 0.002061 -1.17 0.277 A*D 0.002556 0.001278 0.002061 0.62 0.553 Analysis of Variance for BUSHING (coded units) Source DF Seq SS Adj SS Adj MS F P Main Effects 4 0.00060503 0.00060503 0.00015126 2.22 0.156 2-Way Interactions 3 0.00021785 0.00021785 0.00007262 1.07 0.415 Residual Error 8 0.00054388 0.00054388 0.00006798 Pure Error 8 0.00054388 0.00054388 0.00006798 Total 15 0.00136675
 Differences in wear results are not statistically significant Estimated Effects and Coefficients for BUSHING (coded units) Term Effect Coef StDev Coef T P Constant A B Ctg C Seal D A*B A*C A*D Analysis of Variance for BUSHING (coded units) Source DF Seq SS Adj SS Adj MS F P Main Effects Way Interactions Residual Error Pure Error Total")
40
CONCLUSIONS Coating Wear showed very little difference between Chrome and the HVOF carbides –No statistically significant differences throughout test program Opposed Surface Wear favors Cr –Largest statistical significance with Nitrile seals WC-Co-Cr Favored over WC-Co –When statistically significant differences Karon B Wear best against all coatings

Similar presentations


>")

>")


 1. Directly measure the variable. - referred.>")


