Download presentation
Presentation is loading. Please wait.

1
P10505 – Cold Pressure Fusing II Performance Review Team Fusion 5/7/2010

2
Introduction Two results are analyzed, standard deviation to indicate pressure uniformity and average pressure Presentation Outline – Present data – Justify ANOVA assumptions – Analyze significant factors – Analyze interactions – Conclusions

3
Comparison of Average Pressure and Standard Deviation across Skew Angles

4
Signal to Noise Ratios S/N = µ/σ = Std Dev/Mean 1.41.92.4 Standard Deviation1926.51634.191900.81 Average Pressure4161.635011.944631.5 S/N2.163.072.44 N/S0.460.330.41

5
Average Pressure vs. Skew Angle Note: Standard deviation is not the analysis of variance between these average pressure data points. It is the analysis of pressure variations across the entire scan.

6
Standard Deviation vs. Skew Angle

7
Main Effects Plot for Standard Deviation

8
Skew Angle Curve Fit

9
ANOVA Assumptions These assumptions must be justified to perform an Analysis of Variance. – Normal distribution – Constant variance – Constant mean – Independent data

10
Justification of ANOVA Assumptions

12
ANOVA Table for Standard Deviation Analysis of Variance for Average Pressure, using Adjusted SS for Tests SourceDFSeq SSAdj SSAdj MSFP Skew Angle25805582.000 2902791.00018.1800.000 Load19135948.000 57.2100.000 Orientation13083067.000 19.3100.000 Compliance11827931.000 11.4500.002 Skew Angle*Load21170453.000 585226.0003.6600.041 Skew Angle*Orientation21709290.000 854645.0005.3500.012 Skew Angle*Compliance2772812.000 386406.0002.4200.110 Load*Orientation1444098.000 2.7800.108 Load*Compliance1276185.000 1.7300.201 Orientation*Compliance1439110.000 2.7500.110 Skew Angle*Load*Orientation142443.000 21222.0000.1300.876 Skew Angle*Load*Compliance21153858.000 576929.0003.6100.042 Skew Angle*Orientation*Compliance2573191.000 286596.0001.7900.188 Load*Orientation*Compliance155013.000 0.3400.563 Skew Angle*Load*Orientation*Compliance2479479.000 239740.0001.5000.243 Error243832342.000 159681.000 Total4730800800.000 Legend Green: P-value < 0.005 Orange: P-value < 0.015 White: P-value > 0.010

13
Main Effects Plot for Standard Deviation

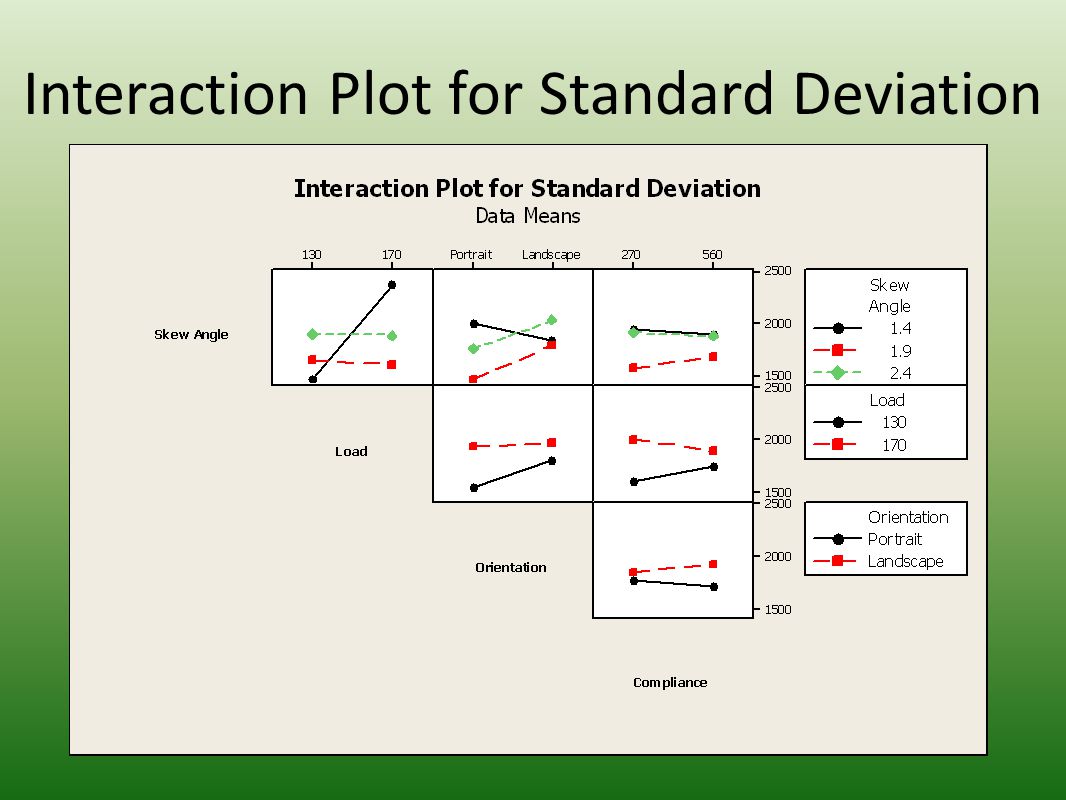
14
Interaction Plot for Standard Deviation

18
ANOVA Table for Average Pressure Analysis of Variance for Standard Deviation, using Adjusted SS for Tests SourceDFSeq SSAdj SSAdj MSFP Skew Angle2838375.000 419188.0004.3800.024 Load1944724.000 9.8700.004 Orientation1271502.000 2.8400.105 Compliance11387.000 0.0100.905 Skew Angle*Load22274411.000 1137205.00011.8800.000 Skew Angle*Orientation2573000.000 286500.0002.9900.069 Skew Angle*Compliance258055.000 29028.0000.3000.741 Load*Orientation1184016.000 1.9200.178 Load*Compliance1182533.000 1.9100.180 Orientation*Compliance160492.000 0.6300.434 Skew Angle*Load*Orientation2222213.000 111106.0001.1600.330 Skew Angle*Load*Compliance238580.000 19290.0000.2000.819 Skew Angle*Orientation*Compliance212875.000 6437.0000.0700.935 Load*Orientation*Compliance165860.000 0.6900.415 Skew Angle*Load*Orientation*Compliance2109942.000 54971.0000.5700.571 Error242297803.000 95742.000 Total478135768.000 Legend Green: P-value < 0.005 Yellow: P-value < 0.010 Orange: P-value < 0.015 White: P-value > 0.010

19
Main Effects for Average Pressure

20
Interaction Plot of Average Pressures

21
Conclusions Abaqus model was on target – Experimental results point to 1.91° as the optimal skew angle to maximize pressure uniformity The average pressure value changes based on the configuration, but several configurations fell in the acceptable pressure range

22
Optimal Design Standard Deviation – Main Effects: 1.9 deg, portrait, 130 lbs, k=270 – 2 nd Order Effects: 1.9 deg, portrait, 170 lbs, k = 270

23
Optimal Design Average Pressure – Main Effects: Load is variable but ~140 lbs, Orientation is variable, no specified preference Compliance is variable but ~415 lbs/in, by interpolation – Interaction effects agree with main effects, except landscape orientation is preferred P-value for the average pressure DOE is 0.105 P-value for the standard deviation DOE is 0.000

26
Representative 1.4° skew angle pressure pattern (U4) 1.4 ° skew angle, k = 270 lb/in (gray), 170 lbs load, landscape
 1.4 ° skew angle, k = 270 lb/in (gray), 170 lbs load, landscape")
27
Representative 1.9° skew angle pressure pattern (U16) 1.9 ° skew angle, k = 270 lb/in (gray), 170 lbs load, landscape
 1.9 ° skew angle, k = 270 lb/in (gray), 170 lbs load, landscape")
28
Representative 2.4° skew angle pressure pattern (U24) 1.9 ° skew angle, k = 270 lb/in (gray), 170 lbs load, landscape
 1.9 ° skew angle, k = 270 lb/in (gray), 170 lbs load, landscape")
29
Average Pressure vs. Test Configuration

30
Standard Deviation vs. Test Configuration

31
Probability Plot of Average Pressure

32
Probability Plot of Standard Deviation

33
Standard Deviation vs. Test Configuration

34
Residuals vs. Test Configuration

35
Standard Deviation vs. Test Configuration

36
Customer Needs

38
Engineering Specifications Engr. Spec. # ImportanceSource Specification (description)Unit of MeasureMarginal ValueIdeal Value ES41Customer NeedPrototype will fuse print across 95% of the page Percentage fused, Width of unfused,90% fusing95% fusing ES61Customer NeedPrototype will vary in nip pressure less than 10% Width of Pressure Indication, Xerox Metric10% variation5% variation ES81Customer Need Prototype must be capable of adjusting to three skew anglesNumber of Settings2 anglesAnalog ES101Customer Need Prototype must adhere to Abaqus model created by XeroxYes/NoN/AYes ES121Customer NeedPrototype must be able to reach a 1.9° skew angleDegrees1.8°-2.0°1.9° ES141Customer Need Prototype must be adjustable to the same skew angle to a 1/10th degree for ~25 runsStandard Deviation 1/5th degree variation 1/10th degree variation ES32Customer NeedPrototype will minimally calendar printQualitativeModerateNone ES52Customer Need Prototype will produce trailing edge wrinkles less than once every twenty printsNumber 1 wrinkle every 10 printsNo wrinkles ever ES113Customer NeedFeed rate must not decrease by more than 15%Torque 15% reduction of speed 5% reduction of speed ES131Implied Prototype must be dimensionally stable for a load of 4000 psiForceVibrationStationary 1Customer Need Prototype vibration will be less than 3 lbs as measured by the load cells.Force5 lbs0 lbs ES94Implied Prototype will take less than 60 secs of user time to set up printTime Required120 sec0 secs ES13ImpliedPrototype must be manufacturable within ~2 weekTime Required, Y/N4 weeks2 week ES71Customer Need Prototype must accommodate both 20 and 24 lb paper while meeting all other specificationsYes/No Accomodates 20 and 24 lb paper Accomodates all paper weights ES153Implied Prototype must be able to print >1000 copies without failure Life Cycle (Number of Prints) 500 copies1000 ES24Customer NeedPrototype must cost less than $3000Dollars$3,000$1,500 Importance Scale: 1-Highest, 4-Lowest
Unit of MeasureMarginal ValueIdeal Value ES41Customer NeedPrototype will fuse print across 95% of the page Percentage fused, Width of unfused,90% fusing95% fusing ES61Customer NeedPrototype will vary in nip pressure less than 10% Width of Pressure Indication, Xerox Metric10% variation5% variation ES81Customer Need Prototype must be capable of adjusting to three skew anglesNumber of Settings2 anglesAnalog ES101Customer Need Prototype must adhere to Abaqus model created by XeroxYes/NoN/AYes ES121Customer NeedPrototype must be able to reach a 1.9° skew angleDegrees1.8°-2.0°1.9° ES141Customer Need Prototype must be adjustable to the same skew angle to a 1/10th degree for ~25 runsStandard Deviation 1/5th degree variation 1/10th degree variation ES32Customer NeedPrototype will minimally calendar printQualitativeModerateNone ES52Customer Need Prototype will produce trailing edge wrinkles less than once every twenty printsNumber 1 wrinkle every 10 printsNo wrinkles ever ES113Customer NeedFeed rate must not decrease by more than 15%Torque 15% reduction of speed 5% reduction of speed ES131Implied Prototype must be dimensionally stable for a load of 4000 psiForceVibrationStationary 1Customer Need Prototype vibration will be less than 3 lbs as measured by the load cells.Force5 lbs0 lbs ES94Implied Prototype will take less than 60 secs of user time to set up printTime Required120 sec0 secs ES13ImpliedPrototype must be manufacturable within ~2 weekTime Required, Y/N4 weeks2 week ES71Customer Need Prototype must accommodate both 20 and 24 lb paper while meeting all other specificationsYes/No Accomodates 20 and 24 lb paper Accomodates all paper weights ES153Implied Prototype must be able to print >1000 copies without failure Life Cycle (Number of Prints) 500 copies1000 ES24Customer NeedPrototype must cost less than $3000Dollars$3,000$1,500 Importance Scale: 1-Highest, 4-Lowest.")
39
Final Design

40
Recommendations

Similar presentations


 Oklahoma.>")
. Quality of Manufacturing Process depends on Entry Criteria.>")


