Download presentation
Presentation is loading. Please wait.

1
Effect Size Tutorial: Cohen’s d and Omega Squared
Jason R. Finley Mon April 1st, 02013 Created and presented while post-doc at Washington University in St. Louis

2
ω2 DEAL WITH IT DEAL WITH IT
If you don't believe that effect sizes are awesome you better get a life right now or they will chop your head off!!! It's an easy choice, if you ask me. DEAL WITH IT

3
Effect Sizes to use Comparison of means (t test): Correlation:
Cohen’s d Calculate using Pooled SD (I’ll demonstrate) Correlation: r is its own effect size! (or r2, whatever) Regression: R2, R2change, R2adjusted ANOVA: Eta squared η2 Omega squared ω2 Standardized Difference Proportion of Variance Explained “Strength of Association” (Hays) Cohen’s d: a standardized difference measure R^2 squared multiple correlation
 Correlation: r is its own effect size! (or r2, whatever) Regression: R2, R2change, R2adjusted. ANOVA: Eta squared η2. Omega squared ω2. Standardized Difference. Proportion of Variance Explained Strength of Association (Hays) Cohen’s d: a standardized difference measure. R^2 squared multiple correlation.")
4
Effect size for comparing two groups: Cohen’s d
Between-Ss or within-Ss t-test Effective range: -3 to 3 Use pooled SD, and say that’s what you did! Cortina & Nouri Eq 1.1 Olejnik & Algina 2000 p245 Keppel & Wickens 2004 p160 (via Fritz, Morris, & Richler, 2012) Note: effect size for a SINGLE-SAMPLE t or z test is just the sample mean divided by the sample SD. effec size for a z-test of differences is just the z statistic itself, since it is already a standardized difference of means. Practically, you won’t usually see d values more extreme than around, say 1.25. “Effect sizes for comparisons of means are reported as Cohen’s d calculated using the pooled standard deviation of the groups being compared (Olejnik & Algina, 2000, Box 1 Option B).” Note this is not the raw variance of the sample, but rather the variance adjusted to be an unbiased estimator of the population variance. That is. It’s based on using N-1, instead of N.
 Note: effect size for a SINGLE-SAMPLE t or z test is just the sample mean divided by the sample SD. effec size for a z-test of differences is just the z statistic itself, since it is already a standardized difference of means. Practically, you won’t usually see d values more extreme than around, say Effect sizes for comparisons of means are reported as Cohen’s d calculated using the pooled standard deviation of the groups being compared (Olejnik & Algina, 2000, Box 1 Option B). Note this is not the raw variance of the sample, but rather the variance adjusted to be an unbiased estimator of the population variance. That is. It’s based on using N-1, instead of N.")
5
Then just plug the values into a formula in Excel
Condition A Condition B 0.5 0.25 0.75 1 mean 0.28 0.47 Variance (adjusted) 0.07 df 7 =AVERAGE(D2:D9) =VAR(D2:D9) Do the same for between or within Ss. Note: formula uses the adjusted variance ( =VAR() ), not the raw variance ( =VARP() ). =COUNT(D2:D9)-1 Then just plug the values into a formula in Excel
 df. 7. =AVERAGE(D2:D9) =VAR(D2:D9) Do the same for between or within Ss. Note: formula uses the adjusted variance ( =VAR() ), not the raw variance ( =VARP() ). =COUNT(D2:D9)-1. Then just plug the values into a formula in Excel.")
6
Single-sample t-test, z-test?
effect size for a SINGLE-SAMPLE t or z test is just the sample mean divided by the sample SD. effect size for a z-test of differences is just the z statistic itself, since it is already a standardized difference of means.

7
ANOVA vs Regression Eta squared ... R2 Epsilon squared ... R2adj
Omega squared ... No equivalent, but could be done Camp & Maxwell 1983 possible R^2 analogue to omega squared

8
Effect Sizes for ANOVA: η2 vs. ω2
Equivalent to R2 in regression! Eta squared η2 Proportion of variance in DV accounted for by IV(s) Partial eta squared η2partial For designs with 2+ IVs Prop. var. accounted for by one particular IV Range: 0-1 Problems: η2 is descriptive of the SAMPLE data Biased: overestimates population effect size Especially when sample size is small Refs for ANOVA vs Regression effect sizes: S. F. Matter (2000). Regression, ANOVA, and estimates of effect size. Bulletin of the Ecological Society of America, January, C. J. Camp & S. E. Maxwell 1983). A comparison of various strengths of association measures commonly used in gerontological research. Journal of Gerontology, 38(1), 3-7. Eta squared also sometimes referred to as R squared. Also may be called correlation ratio Partial eta: partials out variance accounted for by other factors in design
 Partial eta squared η2partial. For designs with 2+ IVs. Prop. var. accounted for by one particular IV. Range: 0-1. Problems: η2 is descriptive of the SAMPLE data. Biased: overestimates population effect size. Especially when sample size is small. Refs for ANOVA vs Regression effect sizes: S. F. Matter (2000). Regression, ANOVA, and estimates of effect size. Bulletin of the Ecological Society of America, January, C. J. Camp & S. E. Maxwell 1983). A comparison of various strengths of association measures commonly used in gerontological research. Journal of Gerontology, 38(1), 3-7. Eta squared also sometimes referred to as R squared. Also may be called correlation ratio. Partial eta: partials out variance accounted for by other factors in design.")
9
Effect Sizes for ANOVA: η2 vs. ω2
Omega squared ω2 INFERENTIAL: estimates population effect size Prop. var. in DV accounted for by IV Way less biased than η2 (will be smaller) Partial omega squared Issues: Not reported by SPSS Can turn out negative (set to 0 if this happens) Formula slightly different for different designs Put a hat on it (ESTIMATED) small: .01 med: .06 large: .14 No equivalent in regression Rough guideline of small/med/large. (Kirk, 1996)
 Partial omega squared. Issues: Not reported by SPSS. Can turn out negative (set to 0 if this happens) Formula slightly different for different designs. Put a hat on it (ESTIMATED) small: .01. med: .06. large: .14. No equivalent in regression. Rough guideline of small/med/large. (Kirk, 1996)")
10
1-way between-subjects ANOVA
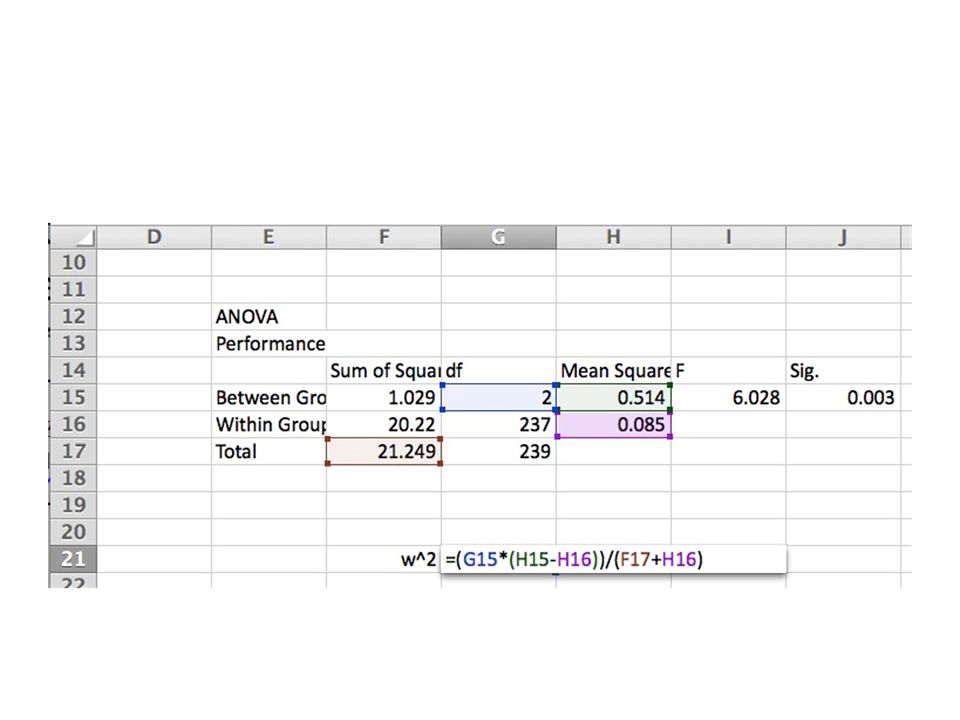
Overall effect size (we’ll get to partial in a minute) All values needed are obtained from ANOVA table Omega squared for different effects, designs: numerator has same general form, just swap in appropriate SS and MSerror (MSE different for differnet effects) Alt formula from Olejnik & Algina (2000) p. 266 I used the alternate form of the formula because it allowed for better consistency across different designs. (?) Dfeffect: # groups in IV manipulation (minus 1). So omega takes this into account =
 All values needed are obtained from ANOVA table. Omega squared for different effects, designs: numerator has same general form, just swap in appropriate SS and MSerror (MSE different for differnet effects) Alt formula from Olejnik & Algina (2000) p I used the alternate form of the formula because it allowed for better consistency across different designs. ( ) Dfeffect: # groups in IV manipulation (minus 1). So omega takes this into account. =")
11
SPSS output for 1-way between-Ss ANOVA
effect error Trick: paste into excel HINT: paste the SPSS output into Excel!... Make a template!

13
1-way within-subjects ANOVA

14
SPSS output for 1-way between-Ss ANOVA
If Mauchly’s test is sig (p<.05), assume sphericity assumption violated, and use one of the corrections (GG, HF, LB). NOTE: only have to worry about this is have more than 2 conditions in any IV. Test for violation of sphericity is not sig., so we can use the “Sphericity Assumed” rows in the tables to follow.
, assume sphericity assumption violated, and use one of the corrections (GG, HF, LB). NOTE: only have to worry about this is have more than 2 conditions in any IV. Test for violation of sphericity is not sig., so we can use the Sphericity Assumed rows in the tables to follow.")
15
SPSS output for 1-way between-Ss ANOVA
effect effect x subject Have to manually add up SStotal from the three sources. (ignore the “Intercept” line) subject
 subject.")
16
Paste into Excel, make your formula

17
Partial Omega Squared When 2+ IVs or
Prop. var. in DV accounted for by one particular IV, partialing out variance accounted for by the other IVs. M&D reasoning: we want partial omega squared to be what we would have gotten if ran experiment with just that one IV. Note alt formulas... or

18
2-way Between-Ss ANOVA: with IVs “A” and “B”
For IV “A”: Regular Partial IV = independent variable, DV = dependent variable Ntotal = total # subjects in experiment

19
SPSS output for 2-way between-Ss ANOVA
IV A: Feedback Condition IV B: Practice Condition If doing regular omega squared, and need SStotal, Use the “Corrected total” row (excludes intercept) Partial
 Partial.")
20
SPSS output for 2-way between-Ss ANOVA
IV A: Feedback Condition IV B: Practice Condition If doing regular omega squared, and need SStotal, Use the “Corrected total” row (excludes intercept) Regular
 Regular.")
21
2-way mixed ANOVA (IV “A” between-Ss, IV “B” within-Ss)
Aka Split plot design Comes down to selecting the appropriate SS and error terms. Pro tip: the AB interaction counts as a within-Ss effect

22
For interaction AB: Effect B Interaction AB Error B, AB: “Bxsubject/A”
Effect A Error A: “subject/A”

23
Paste the relevant tables from SPSS into Excel, make your formula.

24
REMEMBER In the first paragraph of your Results section (just Exp. 1 if multiple exps), clearly state the effect sizes you’ll be reporting. “Effect sizes for comparisons of means are reported as Cohen’s d calculated using the pooled standard deviation of the groups being compared (Olejnik & Algina, 2000, Box 1 Option B).” “Effect sizes for ANOVAs are reported as partial omega squared calculated using the formulae provided by Maxwell and Delaney (2004).”
. Effect sizes for ANOVAs are reported as partial omega squared calculated using the formulae provided by Maxwell and Delaney (2004).")
25
On the horizon Confidence intervals for effect size estimates Maybe?:
Steigler & Fouladi (1997) Fidler & Thompson (2001)
 Fidler & Thompson (2001)")
Similar presentations


: the two.>")


