Download presentation
Presentation is loading. Please wait.

1
Glycolysis ط Steps and key enzymes for glycolysis (irreversible reactions) ط Dual role of glycolysis; degrades glucose to generate ATP and source of synthesis of cell compounds ط Aerobic and Anaerobic glycolysis, Pyruvate and lactate as end products of glycolysis ط Calculation of energy and Inhibitors of glycolysis ط Clinical correlation * Lactic acidosis D

2
Introduction fig7.4, Glycolysis occur in all cells 1. RBCs (anaerobic) – GLUT1: NADPH (PPP), Lactate 2. Brain (aerobic) – GLUT3: NADPH (PPP), CO2+H2O 3. Muscle (both) – GLUT4: CO2+H2O, Lactate, Glycogen 4. AT (aerobic) – GLUT4: NADPH (PPP), Glycogen, FA 5. Liver (both) – GLUT2: NADPH (PPP), Glycogen, FA, Lactate, Glucose, Glucurinides *NADPH for glutathione (organic peroxide, H2O2), FAS, Endoplasmic Reticulum, Ribose Phosphate (ATP, DNA, RNA)
 – GLUT3: NADPH (PPP), CO2+H2O. 3. Muscle (both) – GLUT4: CO2+H2O, Lactate, Glycogen. 4. AT (aerobic) – GLUT4: NADPH (PPP), Glycogen, FA. 5. Liver (both) – GLUT2: NADPH (PPP), Glycogen, FA, Lactate, Glucose, Glucurinides. *NADPH for glutathione (organic peroxide, H2O2), FAS, Endoplasmic Reticulum, Ribose Phosphate (ATP, DNA, RNA)")
3
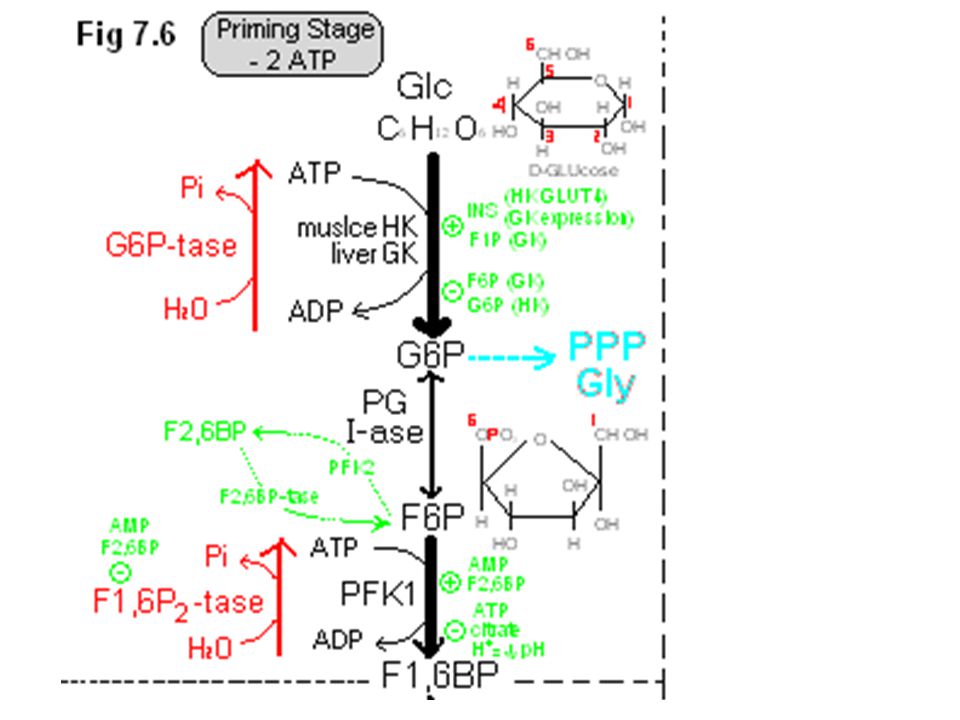
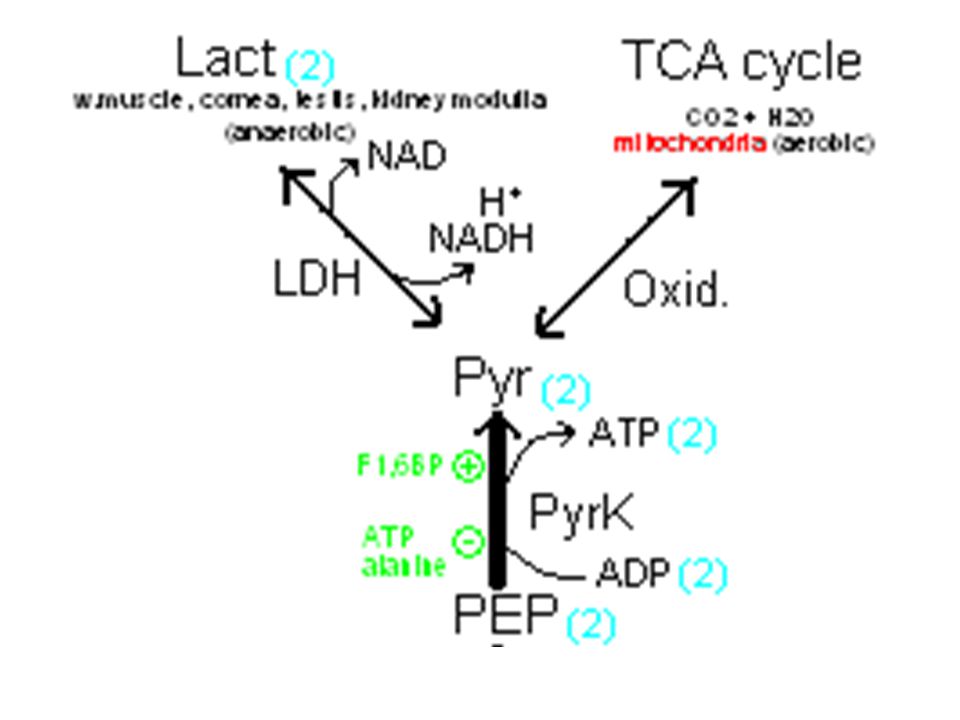
Glycolysis fig7.6, (+8 ATP) 1. Priming Stage: (–2 ATP) Step1: Glu === G6P Step2: G6P F6P (by open chain) Step3: F6P === F1,6P2 *F6P PFK2 (–1 ATP) F2,6P2 2. Splitting Stage: (2 GAP) Step4: F1,6P2 DHAP + GAP (by splitting 3C each) Step5: DHAP GAP 3. Oxidative-phosphorylation Stage: (+10 ATP) Step6: GAP 1,3BPG fig7.7, substrate-level phosphorylation: oxid-reduct (thiohemiacetal, Energetic) = +6 ATP Step7: 1,3BPG 3PG (through BPG shunt, no ATP formed in 15-25% of RBCs) *1,3BPG 2,3BPG M-tase 2,3BPG 2,3BPG P-tase 3PG Step8: 3PG 2PG Stpe9: 2PG PEP Step10: PEP === Pyruvate End product: i. Anaerobic Glycolysis; Pyruvate LDH 2 Lactate LDH utilize NADH to form Lactate … but fig7.9, cytoplasmic NADH when Pyruvate is formed enter mitochondria: a. GP shuttle (muscle) to generate FADH2 (mitochondrial membrane) b. MA shuttle (liver) to generate NADH (mitosol) ii. Aerobic Glycolysis; 2 Citric Acid Cycles (CO2 + H2O, complete glu oxid) *Fermentation; in yeast (Ethanol + CO2)
 F2,6P2. 2. Splitting Stage: (2 GAP) Step4: F1,6P2 DHAP + GAP (by splitting 3C each) Step5: DHAP GAP. 3. Oxidative-phosphorylation Stage: (+10 ATP) Step6: GAP 1,3BPG. fig7.7, substrate-level phosphorylation: oxid-reduct (thiohemiacetal, Energetic) = +6 ATP. Step7: 1,3BPG 3PG (through BPG shunt, no ATP formed in 15-25% of RBCs) *1,3BPG 2,3BPG M-tase 2,3BPG 2,3BPG P-tase 3PG. Step8: 3PG 2PG. Stpe9: 2PG PEP. Step10: PEP === Pyruvate. End product: i. Anaerobic Glycolysis; Pyruvate LDH 2 Lactate. LDH utilize NADH to form Lactate … but. fig7.9, cytoplasmic NADH when Pyruvate is formed enter mitochondria: a. GP shuttle (muscle) to generate FADH2 (mitochondrial membrane) b. MA shuttle (liver) to generate NADH (mitosol) ii. Aerobic Glycolysis; 2 Citric Acid Cycles (CO2 + H2O, complete glu oxid) *Fermentation; in yeast (Ethanol + CO2)")
8
Inhibitors of Glycolysis
1. fig7.10, Deoxyglucose: doGlucose HK doG6P doG6P inhibit HK but is not a substrate (accumulate in cell) 2. fig7.11, Sulfhydryl Reagent (mercury, iodoacetate): GAP GAPDH (+NADH) 1,3BPG mercury binds to –SH of GAPDH & prevents Thiohemiacetal formation, no NADH is formed 3. Fluoride (F): 2PG Enolase PEP fluoride bind to Mg2+/Pi forming an ionic complex, which interferes with enolase binding 4. fig7.12, Arsenate: GAP GAPDH (+NADH) 1,3ABPG PGK (+ATP) 3PG replaces Pi when 1,3BPG is formed, therefore no ATP is yielded when 3PG is formed Arsenic: substitutes Pi & product accumulates (no further ATP produced by glycolysis or TCA cycle)
 2. fig7.11, Sulfhydryl Reagent (mercury, iodoacetate): GAP GAPDH (+NADH) 1,3BPG. mercury binds to –SH of GAPDH & prevents Thiohemiacetal formation, no NADH is formed. 3. Fluoride (F): 2PG Enolase PEP. fluoride bind to Mg2+/Pi forming an ionic complex, which interferes with enolase binding. 4. fig7.12, Arsenate: GAP GAPDH (+NADH) 1,3ABPG PGK (+ATP) 3PG. replaces Pi when 1,3BPG is formed, therefore no ATP is yielded when 3PG is formed. Arsenic: substitutes Pi & product accumulates (no further ATP produced by glycolysis or TCA cycle)")
9
Regulation of Glycolysis, Oxidation of other monosaccharides
ط Regulation of glycolysis (at cellular level), irreversible steps ط Comparison of hexokinase and glucokinase ط Factors affecting glycolysis ط Entry of fructose, galactose and mannose into glycolysis ط Clinical correlation: * Lactose intolerance * Fructose intolerance * Galactosemia D , L
, irreversible steps. ط Comparison of hexokinase and glucokinase. ط Factors affecting glycolysis. ط Entry of fructose, galactose and mannose into glycolysis. ط Clinical correlation: * Lactose intolerance. * Fructose intolerance. * Galactosemia. D , L")
11
Glucokinase (HK 4) Hexokinase (HK 1, 2, 3)
Regulation (irreversible or non-equilibrium reactions) Glucokinase (HK 4) fig 7.14 Hexokinase (HK 1, 2, 3) 1. In liver & pancreatic b-cells 2. high Km & low affinity for glucose (~10mM) 3. Acts only on D-Glu (diet) 4. Inducible Enzyme (Glu, F1P by release from GKRP, INS through gene expression) 5. Inhibited by F6P (by binding to GKRP) 6. Acts on Glu, in response to high Glu concentration following a meal, to remove Glu from blood. 1. In most Tissues 2. Low Km & high affinity for glucose (<0.1mM) 3. Acts on D-Glu & other hexoses (e.g. α-Glu & β-Glu) 4. Constitutive Enzyme (continuous activity) 5. Inhibited by G6P (Allosteric) 6. Acts at low Glu concentration to ensure supply of Glu to other tissues (especially Brain). Thereby maintain concentration gradient between blood & intracellular environment 1. HK (low Km) / GK (high Km) ….. Table * different kinetics!! a) HK: + INS (Glu-R) – G6P (G6P-tase) b) GK: + INS (gene expression) + F1P (GKRP) – F6P (GKRP)
 Glucokinase (HK 4) fig Hexokinase (HK 1, 2, 3) 1. In liver & pancreatic b-cells. 2. high Km & low affinity for glucose (~10mM) 3. Acts only on D-Glu (diet) 4. Inducible Enzyme (Glu, F1P by release from GKRP, INS through gene expression) 5. Inhibited by F6P (by binding to GKRP) 6. Acts on Glu, in response to high Glu concentration following a meal, to remove Glu from blood. 1. In most Tissues. 2. Low Km & high affinity for glucose (<0.1mM) 3. Acts on D-Glu & other hexoses (e.g. α-Glu & β-Glu) 4. Constitutive Enzyme (continuous activity) 5. Inhibited by G6P (Allosteric) 6. Acts at low Glu concentration to ensure supply of Glu to other tissues (especially Brain). Thereby maintain concentration gradient between blood & intracellular environment. 1. HK (low Km) / GK (high Km) ….. Table * different kinetics!! a) HK: + INS (Glu-R) – G6P (G6P-tase) b) GK: + INS (gene expression) + F1P (GKRP) – F6P (GKRP)")
13
a) ATP / AMP ratio (energy): 2ADP AK ATP + AMP;
2. PFK1: rate-limiting enzyme (F6P PGI-ase (reversible) G6P Glu, Gly, PPP a) ATP / AMP ratio (energy): 2ADP AK ATP + AMP; ↓ ATP ↑↑ AMP + ↑↑ ADP by + PFK1 (F6P F1,6P2) / – F1,6P2-tase (F1,6P2 F6P) b) Fig7.17 Cell Environment (cytosolic): · More H+ ions (low pH): Glu (bld) GLUT (membrane) Glycolysis (anaerobic) 2 Lact H+ (cytosol) symport (membrane) 2 Lact + 2 H+ (bld) · Balance between Lact Prod : Lact Utilize 2 Lact LDH Pyr Glu, Gly, PPP c) Tissues use other fuels (KB/FA) to preserve Glu for brain: citrate (TCA cycle, mitosol) don't complete TCA cycle go to cytosol (– glycolysis) KB/FA oxidation (mitosol) d) Fig7.19 INS/GLG: · F2,6P2 promotes glycolysis & inhibit gluconeogenesis by + PFK1, – F1,6P2-tase *F1,6P2 F1,6P2-tase F6P PFK1 F1,6P2 · fig7.25, in LIVER § GLG ↑ cAMP ↓ F2,6 P2-tase inhibit glycolysis by – PFK1, + F1,6P2-tase § fig 7.21, F2,6P2 F2,6P2-tase F6P PFK2 F2,6P2
 G6P Glu, Gly, PPP. a) ATP / AMP ratio (energy): 2ADP AK ATP + AMP; ↓ ATP ↑↑ AMP + ↑↑ ADP by + PFK1 (F6P F1,6P2) / – F1,6P2-tase (F1,6P2 F6P) b) Fig7.17 Cell Environment (cytosolic): · More H+ ions (low pH): Glu (bld) GLUT (membrane) Glycolysis (anaerobic) 2 Lact + 2 H+ (cytosol) symport (membrane) 2 Lact + 2 H+ (bld) · Balance between Lact Prod : Lact Utilize. 2 Lact LDH Pyr Glu, Gly, PPP. c) Tissues use other fuels (KB/FA) to preserve Glu for brain: citrate (TCA cycle, mitosol) don t complete TCA cycle go to cytosol (– glycolysis) KB/FA oxidation (mitosol) d) Fig7.19 INS/GLG: · F2,6P2 promotes glycolysis & inhibit gluconeogenesis by + PFK1, – F1,6P2-tase. *F1,6P2 F1,6P2-tase F6P PFK1 F1,6P2. · fig7.25, in LIVER. § GLG ↑ cAMP ↓ F2,6 P2-tase inhibit glycolysis by – PFK1, + F1,6P2-tase. § fig 7.21, F2,6P2 F2,6P2-tase F6P PFK2 F2,6P2.")
15
fig7.24, PFK2 a/F2,6P2-tase b PK-A PFK2 b/F2,6P2-tase a
cAMP inhibit glycolysis & promotes gluconeogenesis by + PK-A + F2,6P2-tase, – PFK2 § fig7.27, INS promotes glycolysis by i. + cAMP PDE-ase (↑ AMP) : cAMP cAMP PDE-ase AMP ii. + PP-tase: PFK2 b/F2,6P2-tase a PFK2 a/F2,6P2-tase b iii.– PK-A: PFK2 a/F2,6P2-tase b PFK2 b/F2,6P2-tase a · Fig7.28, in HEART § Epineph acts on PK-A, which acts opposite of liver (to ↑ ATP)
 : cAMP cAMP PDE-ase AMP. ii. + PP-tase: PFK2 b/F2,6P2-tase a PFK2 a/F2,6P2-tase b. iii.– PK-A: PFK2 a/F2,6P2-tase b PFK2 b/F2,6P2-tase a. · Fig7.28, in HEART. § Epineph acts on PK-A, which acts opposite of liver (to ↑ ATP)")
17
3. PyrK: has high Km as GK (need high substrate concentration in diet / INS)
a) fig7.30, PyrK a PK-A PyrK b PP-tase PyrK a b) cAMP (GLG) promotes + PK-A: PyrK a "active" è PyrK b "inactive" c) F1,6P2 (PFK1) promotes + PP-tase: PyrK b "inactive" è PyrK a "active" d) PyrK is inhibited (–) by ATP, alanine * GLG inhibit PyrK by promoting gluconeogenesis
 fig7.30, PyrK a PK-A PyrK b PP-tase PyrK a. b) cAMP (GLG) promotes + PK-A: PyrK a active è PyrK b inactive c) F1,6P2 (PFK1) promotes + PP-tase: PyrK b inactive è PyrK a active d) PyrK is inhibited (–) by ATP, alanine. * GLG inhibit PyrK by promoting gluconeogenesis.")
19
Clinical Correlation 1. fig7.17, Lactic Acidosis cc7.5 a. increase in Lact Prod: Excessive exercise, convulsions, Angina, Pulmonary Failure ↓bld circulation ↓O2 to cell ↑Lact + H+ in bld b. decrease in Lact Utilize: Liver diseases, ethanol, Phenformin (drug) ↓gluconeogenesis + ↓TCA cycle + ↓O2 to cell è ↑Lact + H+ in bld 2. fig, Fructose Intolerance cc7.3 Fru FK F1P F1Paldolase DHAP + GAP a. deficiency in F1Paldolase lead to F1P accumulate deplete of Pi & ATP Osmotic lysis b. deficiency in FK is less important (Fru F6P or Sucrose) 3. fig, Galactosemia cc8.3 Gal GalK Gal1P Gal1PUT-ase UDP-Gal UDP-Glu Galctitol a. deficiency in GalK inhibit Gal to Glu drived from Lactose (cataract, CNS damage) b. deficiency in Gal1PUT-ase accumulates Gal1P (liver damage)
 ↓gluconeogenesis + ↓TCA cycle + ↓O2 to cell è ↑Lact + H+ in bld. 2. fig, Fructose Intolerance cc7.3. Fru FK F1P F1Paldolase DHAP + GAP. a. deficiency in F1Paldolase lead to F1P accumulate deplete of Pi & ATP Osmotic lysis. b. deficiency in FK is less important (Fru F6P or Sucrose) 3. fig, Galactosemia cc8.3. Gal GalK Gal1P Gal1PUT-ase UDP-Gal UDP-Glu Galctitol. a. deficiency in GalK inhibit Gal to Glu drived from Lactose (cataract, CNS damage) b. deficiency in Gal1PUT-ase accumulates Gal1P (liver damage)")
20
Clinical Correlation 2. fig, Fructose Intolerance cc7.3 Fru FK F1P F1Paldolase DHAP + GAP a. deficiency in F1Paldolase lead to F1P accumulate deplete of Pi & ATP Osmotic lysis b. deficiency in FK is less important (Fru F6P or Sucrose)
")
21
Clinical Correlation 3. fig, Galactosemia cc8.3 Gal GalK Gal1P Gal1PUT-ase UDP-Gal UDP-Glu Galctitol a. deficiency in GalK inhibit Gal to Glu drived from Lactose (cataract, CNS damage) b. deficiency in Gal1PUT-ase accumulates Gal1P (liver damage)
 b. deficiency in Gal1PUT-ase accumulates Gal1P (liver damage)")
Similar presentations


 involves the breakdown of glucose molecules through a series of reactions catalyzed.>")
 C 6 H 12 O 6 + O 2 Cellular Respiration (Eukaryotic cells) CO 2 + H 2 O.>")


 Lactate or ethanol (anaerobic) (2) Acetyl CoA (aerobic) Acetyl CoA.>")


 October 17, 2003 Haining Zhu Dept. of Molecular.>")


 Dr. Samah Kotb Nasr Eldeen.>")

