Download presentation
Presentation is loading. Please wait.

1
Competitive Contagion Scoring Review Let P be the population distribution of seed choices on graph G For every seed set s that appears with non-zero probability in P, we will compute its expected payoff with respect to P: –average of pay(s,s’) over many trials and many draws of s’ from P –enough draws/trials to distinguish/rank expected payoffs accurately We will then rank the s that appear in P by their expected payoffs If you played s on G, you will receive a number of points equal to the number of other players you strictly beat in expected payoff Example: Suppose s1, s2 and s3 appear in P, and have expected payoffs and population counts as follows: –s1: payoff 0.57, count 11; s2: payoff 0.48, count 71; s3: payoff 0.31, count 18 –if you play s1, your score is 71+18=89; if s2, your score is 18; if s3, your score is 0 If everyone plays the same thing, nobody receives any points You must submit seeds for all graphs in order to receive any credit Your overall score/grade for the assignment is the sum of your scores over all graphs, which will then be curved In general, there is no right/best choice for seeds: depends on P!
 over many trials and many draws of s’ from P –enough draws/trials to distinguish/rank expected payoffs accurately We will then rank the s that appear in P by their expected payoffs If you played s on G, you will receive a number of points equal to the number of other players you strictly beat in expected payoff Example: Suppose s1, s2 and s3 appear in P, and have expected payoffs and population counts as follows: –s1: payoff 0.57, count 11; s2: payoff 0.48, count 71; s3: payoff 0.31, count 18 –if you play s1, your score is 71+18=89; if s2, your score is 18; if s3, your score is 0 If everyone plays the same thing, nobody receives any points You must submit seeds for all graphs in order to receive any credit Your overall score/grade for the assignment is the sum of your scores over all graphs, which will then be curved In general, there is no right/best choice for seeds: depends on P!")
2
Questions Worth Pondering What does it mean for the population distribution P to be an equilibrium? If P is an equilibrium what can we say about different players’ payoffs? If P is an equilibrium and G is connected, what can we say about payoffs? What if G is not connected?

3
Networked Games: Coloring, Consensus and Voting Prof. Michael Kearns Networked Life NETS 112 Fall 2014

4
Experimental Agenda Human-subject experiments at the intersection of CS, economics, sociology, “network science” Subjects simultaneously participate in groups of ~ 36 people Subjects sit at networked workstations Each subject controls some simple property of a single vertex in some underlying network Subjects have only local views of the activity: state of their own and neighboring vertices Subjects have (real) financial incentive to solve their “piece” of a collective (global) task Simple example: graph coloring (social differentiation) –choose a color for your vertex from fixed set –paid iff your color differs from all neighbors when time expires –max welfare solutions = proper colorings Across many experiments, have deliberately varied network structure and task/game –networks: inspired by models from network science (small worlds, preferential attachment, etc.) –tasks: chosen for diversity (cooperative vs. competitive) and (centralized) computational difficulty Goals: –structure/tasks performance/behavior –individual & collective modeling prediction –computational and equilibrium theories
 and (centralized) computational difficulty Goals: –structure/tasks performance/behavior –individual & collective modeling prediction –computational and equilibrium theories.")
5
Experiments to Date Graph Coloring –player controls: color of vertex; number of choices = chromatic number payoffs: $2 if different color from all neighbors, else 0 max welfare states: optimal colorings centralized computation: hard even if approximations are allowed Consensus –player controls: color of vertex from 9 choices payoffs: $2 if same color as all neighbors, else 0 max welfare states: global consensus of color centralized computation: trivial Independent Set –player controls: decision to be a “King” or a “Pawn”; variant with King side payments allowed payoffs: $1/minute for Solo King; $0.50/minute for Pawn; 0 for Conflicted King; continuous accumulation max welfare states: maximum independent sets centralized computation: hard even if approximations are allowed Exchange Economy –player controls: limit orders offering to exchange goods payoffs: proportional to the amount of the other good obtained max welfare states: market clearing equilibrium centralized computation: at the limit of tractability (LP used as a subroutine) Biased Voting –player controls: choice of one of two colors payoffs: only under global agreement; different players prefer different colors max welfare states: all red and all blue centralized computation: trivial Networked Bargaining –player controls: offers on each edge to split a cash amount; may have hidden deal limits and “transaction costs” payoffs: on each edge, a bargaining game --- payoffs only if agreement max welfare states: all deals/edges closed centralized computation: nontrivial, possibly difficult Voting with Network Formation –player controls: edge purchases and choice of one of two colors payoffs: only under global agreement; different players prefer different colors max welfare states: ??? centralized computation: ???

6
Coloring and Consensus

7
“first neighborhood” view [demo]
![first neighborhood view [demo]](http://images.slideplayer.com/12/3406078/slides/slide_7.jpg "first neighborhood view [demo]")
8
Small Worlds Family Simple Cycle5-Chord Cycle20-Chord Cycle Leader Cycle Preferential Attachment, = 2 Preferential Attachment, = 3

9
Art by Consensus

10
Sample Findings Generally strong collective performance –nearly all problems globally solved in a couple minutes or less Systematic effects of structure on performance and behavior: –rewiring harms coloring performance in “clique chain” family –rewiring helps consensus performance in clique chain family Preferential attachment much harder than small worlds for coloring –natural heuristics can give reverse order of difficulty Providing more global views of activity: –helps coloring performance in small world family –harms coloring performance in preferential attachment Coloring problems solved more rapidly than consensus –easier to get people to disagree than agree

11
Biased Voting in Networks

12
Cosmetically similar to consensus, with a crucial strategic difference Deliberately introduce a tension between: –individual preferences –desire for collective unity Only two color choices; challenge comes from competing incentives If everyone converges to same color, everyone gets some payoff But different players have different preferences –each player has payoffs for their preferred and non-preferred color –e.g. $1.50 red/$0.50 blue vs. $0.50 red/$1.50 blue –can have symmetric and asymmetric payoffs High-level experimental design: –choice of network structures –arrangement of types (red/blue prefs) & strengths of incentives –most interesting to coordinate network structure and types
 & strengths of incentives –most interesting to coordinate network structure and types.")
14
Minority Power: Preferential Attachment

15
Summary of Findings 55/81 experiments reached global consensus in 1 minute allowed –mean of successful ~ 44s Effects of network structure: –Cohesion harder than Minority Power: 31/54 Cohesion, 24/27 Minority Power –all 24 successful Minority Powers converge to minority preference! –Cohesion P.A. (20/27) easier than Cohesion E-R –overall, P.A. easier than E-R (contrast w/coloring) –within Cohesion, increased inter-group communication helps some notable exceptions… Effects of incentives: –asymmetric beats weak symmetric beats strong symmetric –the value of “extremists”
 easier than Cohesion E-R –overall, P.A. easier than E-R (contrast w/coloring) –within Cohesion, increased inter-group communication helps some notable exceptions… Effects of incentives: –asymmetric beats weak symmetric beats strong symmetric –the value of extremists .")
16
Effects of “Personality” value fraction < value

17
Behavioral Modeling model: play color c with probability ~ payoff(c) x fraction in neighborhood playing c
 x fraction in neighborhood playing c")
18
Lessons Learned, 2005-2011 At least for n=36, human subjects remarkably good –diverse set of collective tasks –diverse set of network topologies –efficiency ~ 90% across all tasks/topologies Network structure matters; interaction with task –contrast with emphasis on topology alone Importance of subject variability and style/personality Most recently: endogenized creation of the network –network formation games –challenging computationally (best response) and analytically
 and analytically")
20
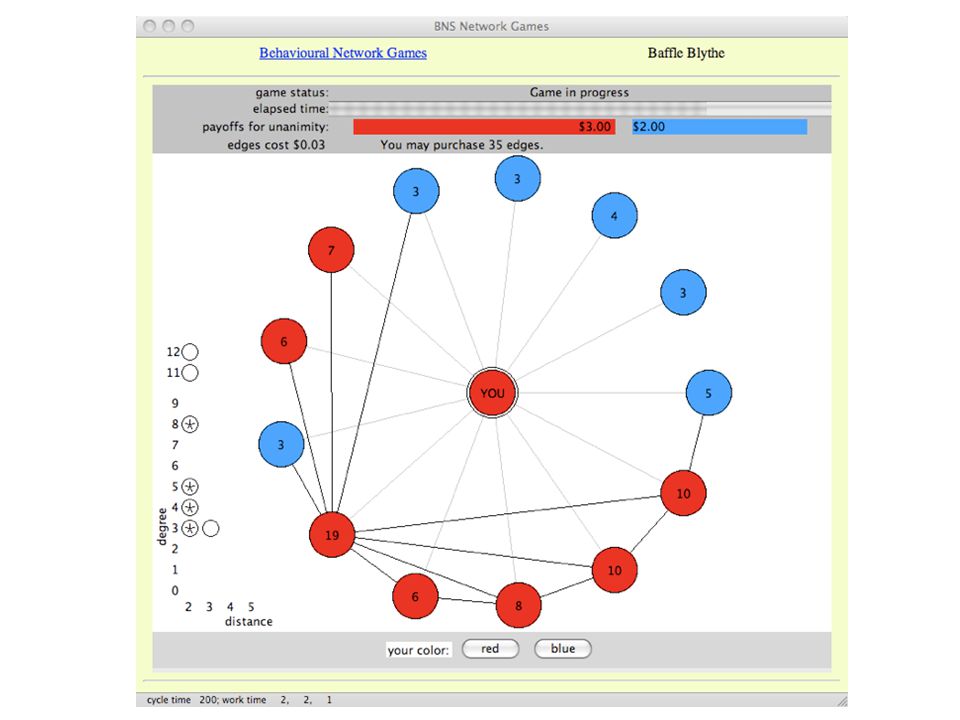
Edge Purchases: Strategic Tensions Buy edges or not? For information or influence? Early in the game or late? To high degree or low degree players? Nearby or far away?

21
Experimental Design Session A: 99 experiments –63 “unseeded” with varying payoffs, imbalances, asymmetries –36 seeded with Minority Power settings Session B: 72 experiments –mixture of unseeded and variety of seeded (cliques, torus) A: 47/99 solved (47%): 25/63 unseeded, MP 22/36 B: 27/72 solved (38%) Session C: 72 experiments –final networks from “hard” settings in Session A –permitted 0 or 1 edge purchases per player –started with both initial and final incentives from Session A C: 25/72 (35%); All: 99/243 (41%) Subjects seem to build difficult networks! [tape]

Similar presentations


![A Network Formation Game for Bipartite Exchange Economies [Even-Dar, K. & Suri]](/13/3808086/big_thumb.jpg "A Network Formation Game for Bipartite Exchange Economies [Even-Dar, K. & Suri]>")
 game theory 2-person game theory (e.g., prisoner’s dilemma)>")


![Behavioral Graph Coloring “An Experimental Study of the Coloring Problem on Human Subject Networks” [Science 313, August 2006] Michael Kearns Computer.](/16/4923023/big_thumb.jpg "Behavioral Graph Coloring “An Experimental Study of the Coloring Problem on Human Subject Networks” [Science 313, August 2006] Michael Kearns Computer.>")

 games, mixed strategies, Nash equil. –the basic objects of vanilla game theory –the power of private.>")


 Networked Life CSE 112 Spring 2007 Michael.>")


