Download presentation
Presentation is loading. Please wait.

1
Ligands and reversible binding

2
Ligands

3
Kinetic experiments study the rate at which reactions happen.- how conc of reactant and product change as funct of time. Rate of reaction is slope. Rate of reaction decreases as reaction proceeds. Chemical kinetics

4
Equilibrium experiments study how conc of reaction products change as function of reactant concentrations. A+B AB. Increasing amount of A is titrated against fixed amount of B and equilibrium conc of product AB determined. Equilibrium

5
Thermodynamics

6
Rate constants and equilibrium constant Consider a process in which a ligand (L) binds reversibly to a site in the protein (P) kaka kdkd Ka= [PL] [P][L] = kakdkakd
![Rate constants and equilibrium constant Consider a process in which a ligand (L) binds reversibly to a site in the protein (P) kaka kdkd Ka= [PL] [P][L] = kakdkakd](http://images.slideplayer.com/12/3403099/slides/slide_6.jpg "Rate constants and equilibrium constant Consider a process in which a ligand (L) binds reversibly to a site in the protein (P) kaka kdkd Ka= [PL] [P][L] = kakdkakd")
7
In practice, we can often determine the fraction of occupied binding sites Ka= [PL] [P][L] == [PL] [PL]+[P] Bound protein Total protein Kd= [P][L] [PL] == [L] [L]+ Kd The fraction of bound sites depends on the free ligand concentration and Kd In a typical experiment, ligand concentration is the known independent variable
![In practice, we can often determine the fraction of occupied binding sites Ka= [PL] [P][L] == [PL] [PL]+[P] Bound protein Total protein Kd= [P][L] [PL] == [L] [L]+ Kd The fraction of bound sites depends on the free ligand concentration and Kd In a typical experiment, ligand concentration is the known independent variable](http://images.slideplayer.com/12/3403099/slides/slide_7.jpg "In practice, we can often determine the fraction of occupied binding sites Ka= [PL] [P][L] == [PL] [PL]+[P] Bound protein Total protein Kd= [P][L] [PL] == [L] [L]+ Kd The fraction of bound sites depends on the free ligand concentration and Kd In a typical experiment, ligand concentration is the known independent variable")
8
Ligand binding to protein The fraction of ligand-binding sites occupied plotted against conc of free ligand

10
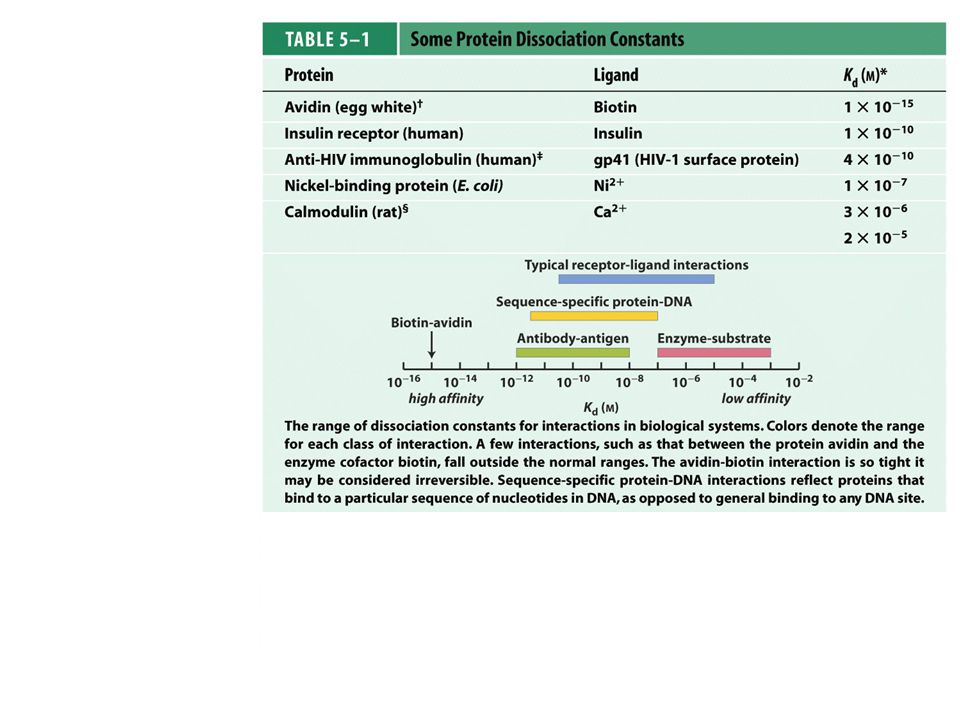
Interaction strength can be expressed as: – association (binding) constant K a, units M ‐ 1 – dissociation constant K d, units M, K d = 1/K a – interaction (binding) free energy G o, units: kJ/mol Definitions: – G o = H o ‐ T S o : enthalpy and entropy – K a = [PL]/[P][L] - K d =[P][L]/[PL] Relationships: – G o = ‐ RT ln K a = RT ln K d ( RT at 25 o C is 2.48 kJ/mol ) Magnitudes – Strong binding: K d < 10 nM – Weak binding: K d > 10 uM
![Interaction strength can be expressed as: – association (binding) constant K a, units M ‐ 1 – dissociation constant K d, units M, K d = 1/K a – interaction (binding) free energy G o, units: kJ/mol Definitions: – G o = H o ‐ T S o : enthalpy and entropy – K a = [PL]/[P][L] - K d =[P][L]/[PL] Relationships: – G o = ‐ RT ln K a = RT ln K d ( RT at 25 o C is 2.48 kJ/mol ) Magnitudes – Strong binding: K d < 10 nM – Weak binding: K d > 10 uM](http://images.slideplayer.com/12/3403099/slides/slide_10.jpg "Interaction strength can be expressed as: – association (binding) constant K a, units M ‐ 1 – dissociation constant K d, units M, K d = 1/K a – interaction (binding) free energy G o, units: kJ/mol Definitions: – G o = H o ‐ T S o : enthalpy and entropy – K a = [PL]/[P][L] - K d =[P][L]/[PL] Relationships: – G o = ‐ RT ln K a = RT ln K d ( RT at 25 o C is 2.48 kJ/mol ) Magnitudes – Strong binding: K d < 10 nM – Weak binding: K d > 10 uM")
11
Myoglobin

13
Heme

15
Myoglobin, Histidine and oxygen

16
Carbon Monoxide CO has similar size and shape to O2; it can fit to the same binding site CO binds over 20,000 times better than O2 because the carbon in CO has a filled lone electron pair that can be donated to vacant d-orbitals on the Fe2+ Myoglobin Protein pocket decreases affinity for CO, but it still binds about 250 times better than oxygen CO is highly toxic as it competes with oxygen. It blocks the function of myoglobin, hemoglobin, and mitochondrial cytochromes that are involved in oxidative phosphorylation

17
Myoglobin Oxygen binding

18
Hemoglobin Oxygen binding.

19
Hemoglobin cycle

20
XXX

21
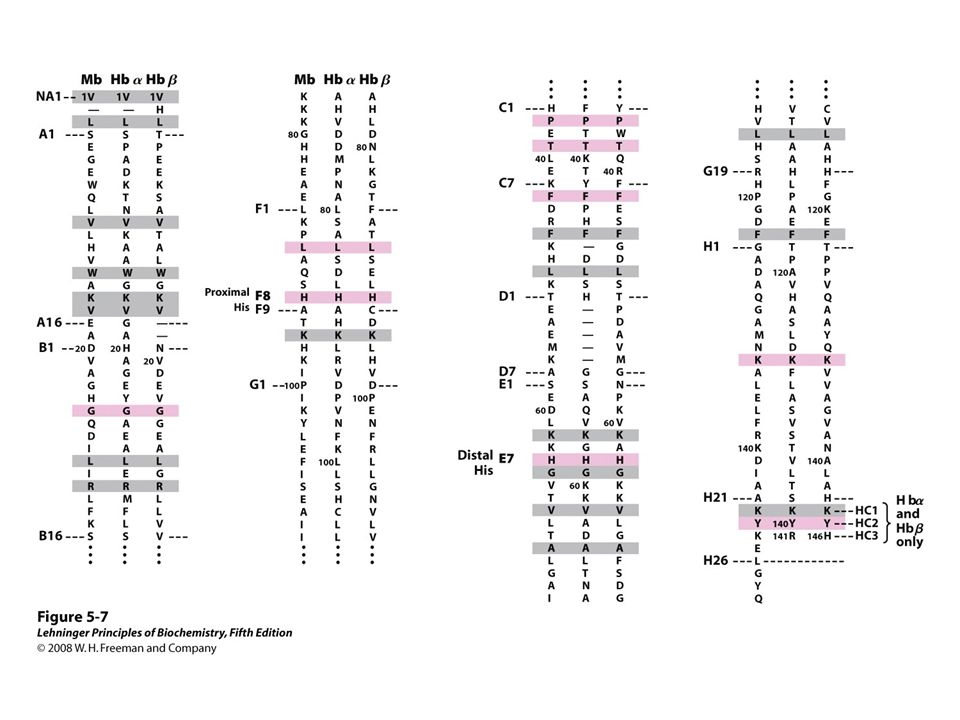
Myoglobin and Hemoglobin structures

26
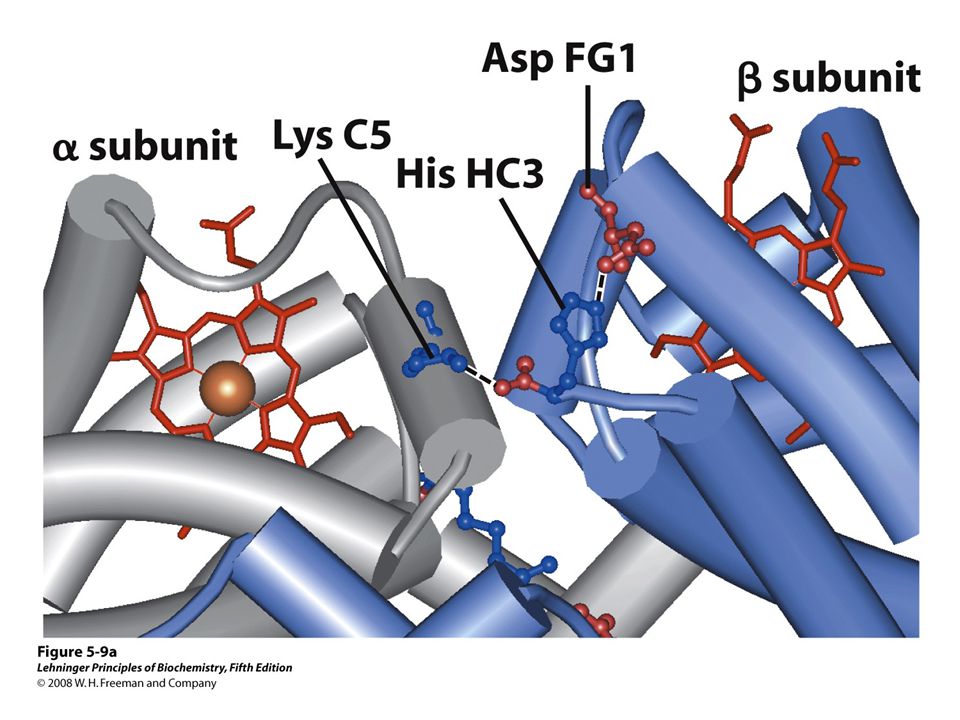
T and R structures

27
HiK K K K K K O OO O T state Tissues = low pH Low O2 conc (4 kPa) No oxygen bound H+/CO 2 bound CO2 Hi K K R state Lungs = high pH High O2 (13.3 kPa) Oxygen bound No H+/CO 2 bound T and R states
 No oxygen bound H+/CO 2 bound CO2 Hi K K R state Lungs = high pH High O2 (13.3 kPa) Oxygen bound No H+/CO 2 bound T and R states")
30
Allosteric Interactions Protein Modulator binds Modulator induces change Ligand binds protein Heterotropic Ligand Protein Homotropic Ligand induces change in protein and binds protein

31
Ligand concentration % bound by Ligand 50 100 Myo Hb Myoglobin and Hemoglobin O2 binding

32
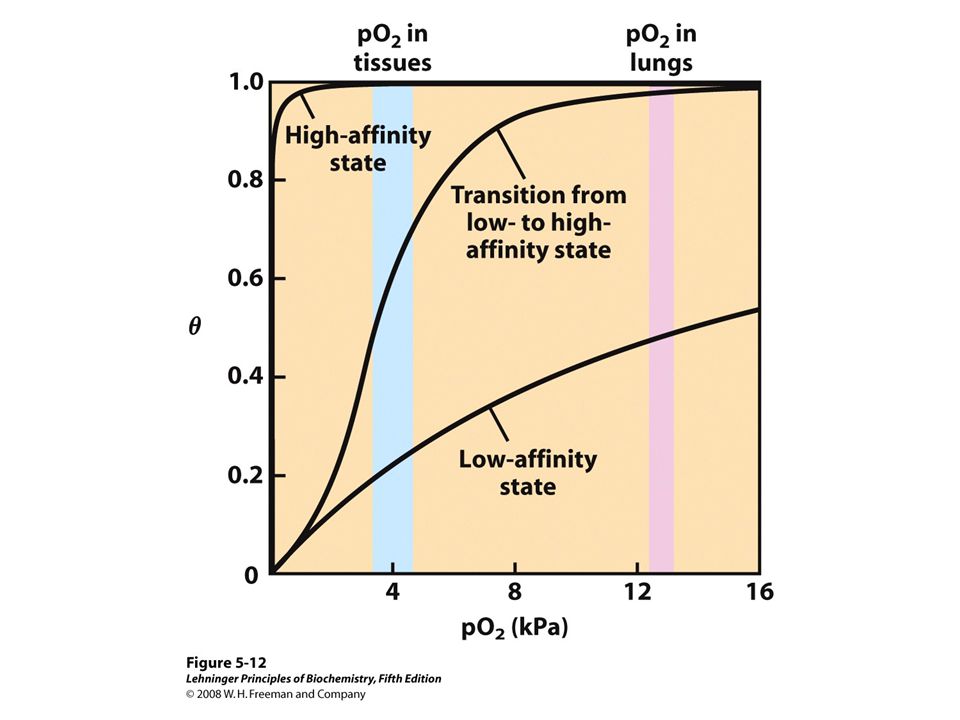
Slope and degree of co-operativity Slope is the measure of the degree of co-operativity For Hb in the low and high affinity states, their slopes indicate no-cooperativity For Hb in the intermediate states, the slope indicates high cooperativity

34
Co-operativity

37
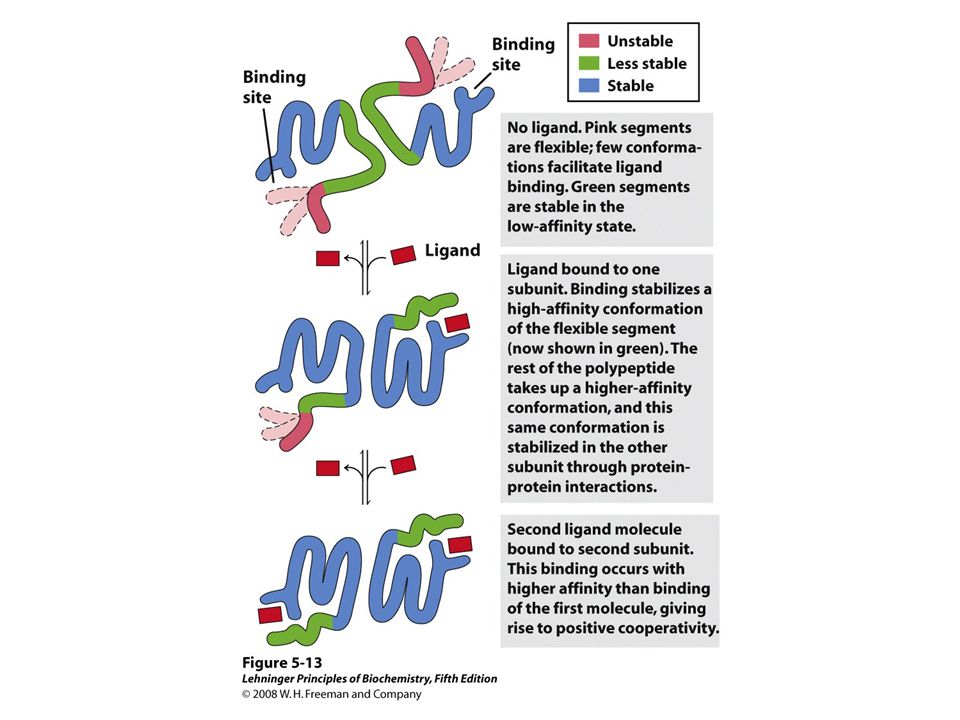
Molecular models for cooperativity

40
XXXXXXX

42
Induced fit

Similar presentations


 Kd- Dissociation constant.>")


 Binding of ligands to a biomolecule can affect the ability of other active sites to bind ligands and is called cooperative.>")


