Download presentation
Presentation is loading. Please wait.

1
Corporate Finance A2 Vysoká škola finanční a správní Winter Semester 2012 Jaromír R. Stemberg jaromir@mail.vsfs.cz

2
Course Layout Twelve two-hour lessons The course is to introduce general financial management problems, realtions, terminology, and solutions Ends with an Exam (zkouška)
")
3
Literature Block, Stanley: Foundations of Financial Management McGraw-Hill, 2009 ISBN 978-0-07-128525-4

4
Grading Written test, oral exam

5
Contents Review of the Last Semester Time Value of Money Valuation and Rate of Return Cost of Capital and Capital Budgeting Capital Markets Bonds, Stock and Security Financing

6
History of Money and Accounting

7
Money Barter trade Cowry shells form 1200 B.C. in China till mid 20 th century in Africa Precious metal coins, banknotes Development of banking “Plastic money” of today

8
Development of Accounting Babylon, 18 th century B.C. - first organized records kept to account for assets and loans Italy, 13 th century A.D. - double-entry bookkeeping 20 th century A.D. - international accounting standards US GAAP and IAS/IFRS

9
Financial Reports and Analysis

10
Balance Sheet Assets Liabilities Current AssetsCurrent Liabilities Cash and EquivalentsShort-Term Accounts Payable Short-Term ReceivablesCurrent Tax Payable InventoryShort-Term Loans and Borrowings Accruals and Other S/T AssetsAccruals and Other S/T Liabilities Long-Term AssetsLong-Term Liabilities Intangible Fixed AssetsLong-Term Payables Tangible Fixed AssetsProvisions Long-Term Receivables Owners’ Equity Share Capital Share Premium and Capital Funds Retained Earnings Y-T-D Profit (Loss)
")
12
Cash Flow Statement

13
Ratios and Analyses Profitability Ratios - profit margin - return on assets (investments), return on equity Asset Utilization Ratios - receivable, inventory, fixed, total assets turnover - average collection period, days of sales outstanding Liquidity Ratios - current ratio - quick ratio Analyses - DuPont analysis - horizontal, vertical, trend
, return on equity Asset Utilization Ratios - receivable, inventory, fixed, total assets turnover - average collection period, days of sales outstanding Liquidity Ratios - current ratio - quick ratio Analyses - DuPont analysis - horizontal, vertical, trend")
14
Du Pont Analysis

15
Forecast and Budget

16
Budgetting Systematic setting of future goals Bottom-up or top-down Identification of external influence and risks (such as customers, competition, macroeconomics) Identification of external influence and risks (such as capacity of production and resources, human factor) Setting of expected growth (reduction), pipeline, percent-of-sales, investment planning
 Identification of external influence and risks (such as capacity of production and resources, human factor) Setting of expected growth (reduction), pipeline, percent-of-sales, investment planning")
17
Financial Forecasting Pro forma income statement Revenue (pipeline, funnel, percentage) Expenses (variable, fixed) Pro forma balance sheet A/R, A/P, inventory Fixed assets, liabilities, equity Pro forma cash flow statement
 Expenses (variable, fixed) Pro forma balance sheet A/R, A/P, inventory Fixed assets, liabilities, equity Pro forma cash flow statement")
18
Operational and Financial Leverage

19
Fixed and variable expenses 0 $ total expenses fixned expenses No. of units produced

20
Fixed and variable expenses No. of units produced $ fixned expenses total expenses

21
$ Break-Even Point No. of units produced revenue total expenses fixed expenses

22
Break-Even Point profit revenue total expenses fixed expenses $ No. of units produced

23
$ Break-Even Point No. of units produced revenue total expenses fixed expenses

24
Operational leverage Uses fixed/variable cost Can increase profits but increases risk _ Fixed costs _ Price – Variable cost per unit

25
Operational leverage _ Fixed costs _ Price – Variable cost per unit Fixed cost 60.000Fixed cost 12.000 Variable cost 0,80 / unitVariable cost 1,60 / unit Unit price 2,00Unit price 2,00 60.000/(2,00-0,80) = 50.00012.000/(2,00-1,60)= 30.000 break-even point isbreak-even point is 50.000 units30.000 units
 = /(2,00-1,60)= break-even point isbreak-even point is units units")
26
Financial Leverage 2 firms: exactly the same Same sector Same opportunities Same Management… The only difference: the debt L (leveraged firm) has 50% of debt U (unleveraged firm) has no debt
 has 50% of debt U (unleveraged firm) has no debt")
27
Financial Leverage Firm UFirm L Shares (Capital) Financial debt Total 100 000 0 100 000 50 000 100 000 Number of shares (Price of a share 100) 1 000 500 EBIT Financial interests (interest rate 5%) Net income before tax EPS before tax 10 000 0 10 000 10 (10 000/1 000) 10 000 2 500 7 500 15 (7 500/500) Net income after tax (Tax rate 33%) EPS after tax 6 700 6,70 5 000 10,00
 Financial debt Total Number of shares (Price of a share 100) EBIT Financial interests (interest rate 5%) Net income before tax EPS before tax (10 000/1 000) (7 500/500) Net income after tax (Tax rate 33%) EPS after tax , ,00")
28
Financial Leverage The shareholder of L has a return of 15 (before tax) The shareholder of U has a return of 10 (before tax) What do you prefer?
 The shareholder of U has a return of 10 (before tax) What do you prefer")
29
Financial Leverage Firm UFirm L Shares Financial debt Total 100 000 0 100 000 50 000 100 000 Number of shares (Price of a share 100) 1 000 500 EBIT Financial interests (interest rate 5%) Net income before tax EPS before tax 0 2 500 -2 500 -5 Net income after tax EPS after tax 0 -2 500 -5
 EBIT Financial interests (interest rate 5%) Net income before tax EPS before tax Net income after tax EPS after tax")
30
Financial Leverage The shareholder of L has a return of -5 (before tax) The shareholder of U has a return of 0 (before tax) What do you prefer?
 The shareholder of U has a return of 0 (before tax) What do you prefer")
31
Financial Leverage For leverage to be profitable, the rate of return on the investment must be higher than the cost of the borrowed money Conclusion Leverage can create value or destroy it To create value, the IRR must be higher than the cost of loan; if not, leverage destroys value.

32
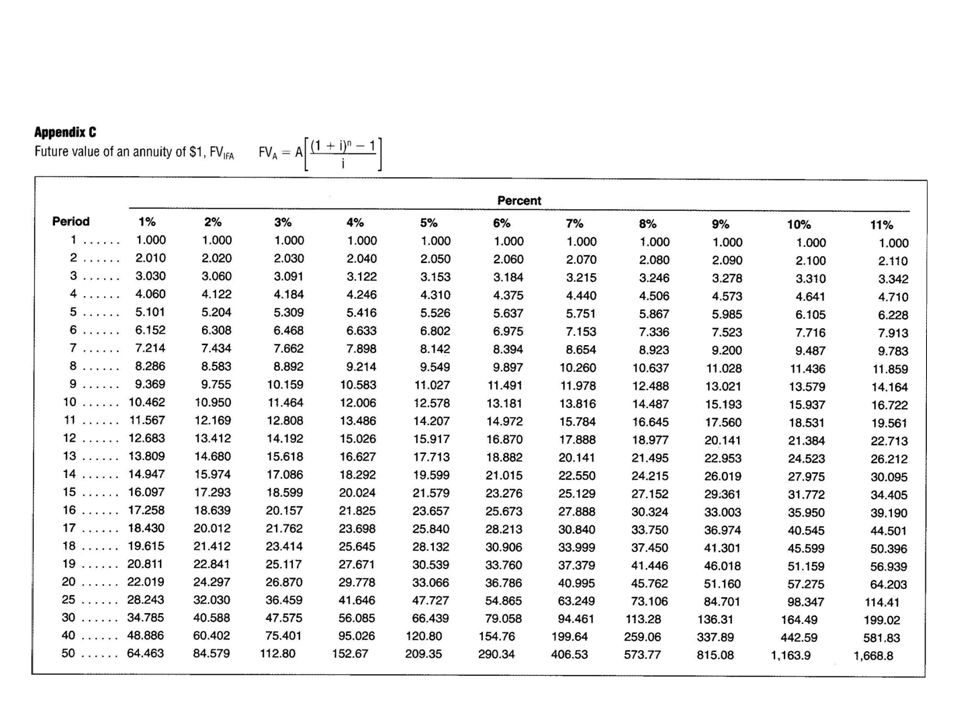
Time Value of Money

38
Valuation and Rate of Return

39
Objectives The valuation of a financial asset is based on the present value of the future cash flows The required rate of return in valuing an asset is based on the risk involved

40
Bonds Coupon / zero coupon bonds Valuation of bonds: present value of future cash inflows P = P.. bond price Y.. Yield P n.principal payment at maturity i.. interest (or expected return) t.. number corresponding to a period n..number of periods n Σ YtYt + PnPn (1+i) t (1+i) n t=1
 t.. number corresponding to a period n..number of periods n Σ YtYt + PnPn (1+i) t (1+i) n t=1.")
41
Stock Infinite stream of level dividend payments Constant growth in dividends D.. dividend payment r.. required rate of return g..dividend growth

42
Cost of Capital

43
Weighted average of: -cost of debt (loans, bonds) -cost of equity (common stock, preferred stock)
 -cost of equity (common stock, preferred stock)")
44
Cost of Debt Interest payment minus tax K d = i (1 – t) K d.... Cost of debt i.... Interest paid t.... corporate tax rate

45
Cost of Equity Dividend devided by market price K e = D / P 0 K e.... cost of equity D.... current dividend P 0.... market price of the stock If dividends constantly grow, then K e = (D / P 0 ) + g g.... constant growth rate in dividends Selling costs are to be deducted from price for newly issued stock
 + g g.... constant growth rate in dividends Selling costs are to be deducted from price for newly issued stock.")
Similar presentations