Download presentation
Presentation is loading. Please wait.

1
Charm in AuAu200 with Silicon Run-7 (2007) BNL, KENT, NANTESBNL, March 15 2011 Intro X-section work Flow work
 BNL, KENT, NANTESBNL, March Intro X-section work Flow work")
2
When Yuri and I proposed the ‘swan song’ for Silicon Run-7 AuAu200, we estimated a significance of 10-20 sigma. Silicon did not behave as expected but we still have a 10 sigma signal sum for near mbias. It would be nice if we get (at least) one Silicon publication
 one Silicon publication.")
3
1 st Production 35 Million Events (~60 Millions full/raw in 2007) Single step Background subtraction Need to study systematics of Background (++--, rot, mixed) Significance should allow for smaller errors in x-sections/flow. D0+D0bar

4
4 Invariant mass of D 0 and D 0 bar separately Ratio of D 0 bar/D 0 = 1.05 +/-.19(stat.) Uncorrected raw yield Au+Au at s=200GeV Uncorrected raw yield Au+Au at s=200GeV STAR PRELIMINARY Compatible with vanishing B (consistency check)
 Uncorrected raw yield Au+Au at s=200GeV Uncorrected raw yield Au+Au at s=200GeV STAR PRELIMINARY Compatible with vanishing B (consistency check)")
5
Charm Cross-Section Comparison at 200 GeV NLO Ref: R. Vogt, arXiv:0709.2531v1 [hep-ph] PHENIX: S. Adler, et al. Phys. Rev. Lett. 94 082301 (2005) S. Adler, et al. Phys. Rev. Lett. 97 252002 (2005) STAR: C. Adler, et al. Phys. Rev. Lett. 91 172302 (2003) S. Baumgart, arXiv:nucl-ex/0709.4223 Y. Zhang, arXiv:nucl-ex/0607011 STAR There are still unresolved discrepancies between STAR and PHENIX
 S. Adler, et al. Phys. Rev. Lett (2005) STAR: C. Adler, et al. Phys. Rev. Lett (2003) S. Baumgart, arXiv:nucl-ex/ Y. Zhang, arXiv:nucl-ex/ STAR There are still unresolved discrepancies between STAR and PHENIX.")
6
X – Section / R CP

7
We need, basically, two things: A handle on centrality (usually done via gRefMult) A p T spectrum, normalized and corrected
 A p T spectrum, normalized and corrected")
8
Au+Au data set 3 rd production – Summary of changes With D 0 and D 0 -bar information saved, plus ++,-- pairs Calculation of v2 (flow) (save Event plane, D0 phi angle). Select only Triggered Events (Pile-up events are removed). Tracks with SiHits>1 are selected gRefMult properly calculated/saved Radius of Silicon Hits added to the tuple. dEdx cut was modified: |n σ K |<2.5 and |n σ π |< 2.5 Relaxed the cut on track pseudorapidity to|η|<1.2 and added a cut on rapidity of D0 (|Rapidity|<1). Au+Au data set 3 rd production – Summary of changes With D 0 and D 0 -bar information saved, plus ++,-- pairs Calculation of v2 (flow) (save Event plane, D0 phi angle). Select only Triggered Events (Pile-up events are removed). Tracks with SiHits>1 are selected gRefMult properly calculated/saved Radius of Silicon Hits added to the tuple. dEdx cut was modified: |n σ K |<2.5 and |n σ π |< 2.5 Relaxed the cut on track pseudorapidity to|η|<1.2 and added a cut on rapidity of D0 (|Rapidity|<1). J. Joseph, UCLA 2010
. Tracks with SiHits>1 are selected gRefMult properly calculated/saved Radius of Silicon Hits added to the tuple. dEdx cut was modified: |n σ K |<2.5 and |n σ π |< 2.5 Relaxed the cut on track pseudorapidity to|η|<1.2 and added a cut on rapidity of D0 (|Rapidity|<1). Au+Au data set 3 rd production – Summary of changes With D 0 and D 0 -bar information saved, plus ++,-- pairs Calculation of v2 (flow) (save Event plane, D0 phi angle). Select only Triggered Events (Pile-up events are removed). Tracks with SiHits>1 are selected gRefMult properly calculated/saved Radius of Silicon Hits added to the tuple. dEdx cut was modified: |n σ K |<2.5 and |n σ π |< 2.5 Relaxed the cut on track pseudorapidity to|η|<1.2 and added a cut on rapidity of D0 (|Rapidity|<1). J. Joseph, UCLA")
9
Centrality definition in two Productions 1 st Production scaled by 1/N 2 3 rd Production Some ‘gRefMult’ was saved in 1 st prod in each D0 candidate (same Ttree) Assuming background scaling ~N 2 it can be taken out and compared to 3 rd production one
 Assuming background scaling ~N 2 it can be taken out and compared to 3 rd production one")
10
3 rd Prod. 1 st Prod. Scaling factor = 0.54 10% 20%

11
1 st Prod. 10% 20% Translation between 1 st – 3 rd prod can be done (till 3 rd done!) it breaks for very peripheral event
 it breaks for very peripheral event.")
12
MC Glauber 3 rd Production 3 rd /Glauber ‘agree’ with some scaling Anthony’s recipe can be applied (next page)
")
13
The blue line in the right panel is a simple power-law parameterization with the following form: Anthony’s page http://www.star.bnl.gov/protected/lfspectra/atimmins/AuAu200GeV/Centrality/page.html

14
# 0 0.0 5.0 1071.15136 28.86369 1 5.0 10.0 856.00949 27.07721 2 10.0 15.0 679.38636 29.37362 3 15.0 20.0 538.11334 31.77548 4 20.0 25.0 423.83548 33.48517 5 25.0 30.0 330.47211 33.10284 6 30.0 35.0 255.11795 31.87105 7 35.0 40.0 193.21495 29.23839 8 40.0 45.0 143.64982 26.58618 9 45.0 50.0 104.92886 23.29735 10 50.0 55.0 75.55448 19.44248 11 55.0 60.0 53.32763 15.95996 12 60.0 65.0 36.73836 12.85724 13 65.0 70.0 24.60467 10.01745 14 70.0 75.0 16.35838 7.17882 15 75.0 80.0 10.72753 4.89949 16 80.0 100.0 0.00000 0.00000 17 0.0 10.0 962.24356 27.62486 18 10.0 20.0 608.80619 31.13144 19 20.0 30.0 377.28963 33.31035 20 30.0 40.0 223.78571 30.45595 21 40.0 50.0 124.28160 24.57038 22 50.0 60.0 64.41547 17.68858 23 60.0 70.0 30.52276 11.45862 24 70.0 80.0 13.38789 6.13034 25 10.0 40.0 402.56989 30.98629 26 40.0 80.0 59.05808 14.32830 27 0.0 20.0 785.17892 28.68245 28 20.0 40.0 300.34868 31.50580 29 40.0 60.0 94.55218 20.93216 30 60.0 80.0 22.20168 8.43855 31 20.0 50.0 241.63616 29.69478 32 50.0 80.0 36.56368 11.38614 33 0.0 60.0 392.58020 26.76773 34 0.0 80.0 302.61491 21.08350 http://www.star.bnl.gov/protected/common/common2010/centrality/200GeV/table/table_Ncoll_vs_centrality_systematicerror.txt Hiroshi’s page

15
D0 - p T

16
D0 p T is done by subtracting from central mass peak (signal) the normalized sum of the two side bands (background)
 the normalized sum of the two side bands (background)")
17
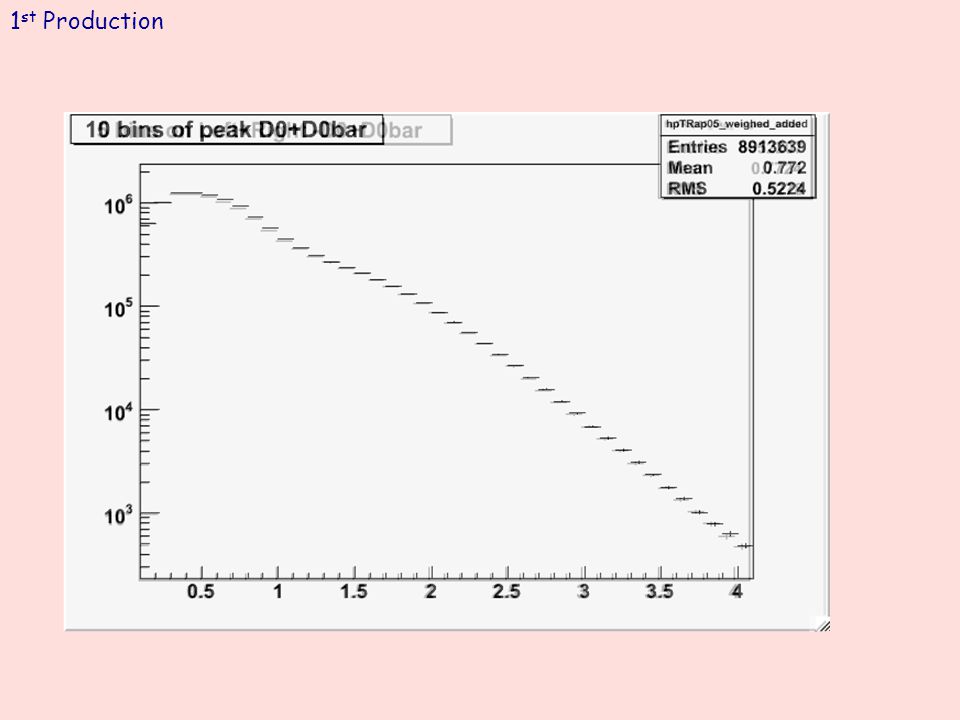
1 st Production

18
1/N EVENTS 1/p T dN/dp T p T (GeV/c) Uncorrected p T spectra for D0+D0bar in |y|<1 We have the embedding to do corrections
 Uncorrected p T spectra for D0+D0bar in |y|<1 We have the embedding to do corrections")
19
Jaiby’s plot from embedding here

20
http://drupal.star.bnl.gov/STAR/system/files/efficiency_Si_run7_embeddingMeeting1213.pdf Embedding - Monitoring/micro-tuning efficiency

21
Run-7 Embedding Bad days http://drupal.star.bnl.gov/STAR/system/files/efficiency_Si_run7_embeddingMeeting1213.pdf Embedding - Monitoring/micro-tuning

23
D0 - FLOW

24
QYQY QXQX r (radians) QXQX QYQY 3 rd Production These are average pictures of re-centering done in 4 centrality bins
 QXQX QYQY 3 rd Production These are average pictures of re-centering done in 4 centrality bins")
25
QYQY QXQX QYQY QXQX r (radians) 3 rd Production
 3 rd Production")
26
To be continued next week some time …..

27
Summary

28
BackUp

29
Vertex fit gives more that factor of two better resolution, compared to simple helix swim Important in an exponential falling variable FIT Secondary vertex resolution plots (X, Y, Z) J. Vanfossen

30
Cuts from previous production 2007 Production MinBias Cuts in New Production EVENT level triggerId : 200001, 200003, 200013 Primary vertex position along the beam axis : |zvertex| < 10 cm Resolution of the primary vertex position along the beam axis: | zvertex |< 200µm TRACKS level Number of hits in the vertex detectors : SiliconHits>2 (tracks with sufficient DCA resolution) Momentum of tracks p >.5GeV/c Transverse Momentum of tracks p T >.5GeV/c Number of fitted TPC hits > 20 Pseudo-rapidity : | |<1 (SSD acceptance) dEdxTrackLength>40 cm DCA to Primary vertex (transverse), DCA xy <.1 cm EVENT level triggerId : 200001, 200003, 200013 Primary vertex position along the beam axis : |zvertex| < 10 cm Resolution of the primary vertex position along the beam axis: | zvertex |< 200µm TRACKS level Number of hits in the vertex detectors: SiliconHits>1 Transverse Momentum of tracks p T >.5GeV/c Ratio TPC hits Fitted/Possible > 0.51 Pseudo-rapidity : | |<1.2 dEdxTrackLength>40 cm DCA to Primary vertex (transverse), DCA xy <.2 cm Radius of first hit on track : < 9 cm if number of silicon hits =2 < 13 cm else D 0 candidate |y(D 0 )|<1 |cos( *)|<0.8 cut changed new cut J. Joseph, UCLA 2010

31
Cuts from previous production Continued.. Cuts in New Production DECAY FIT level Probability of fit >0.1 && |sLength|<.1cm Particle ID : ndEdx : |n K |<2, |n π |<2 DECAY FIT level Probability of fit >0.01 && |sLength|<.1cm Particle ID : ndEdx : |n K |<2.5, |n π |<2.5 Particle identification : ndEdx : |n K |<2, |n π |<2 |cos( *)|<0.6 DCA daughters < 300 µm In both productions we made a pico file for further analysis. Cuts Used for making a pico file Previous Production New Production |D0Eta|<1.85 |Cos(θ*)<0.6 J. Joseph, UCLA 2010
|<0.6 DCA daughters < 300 µm In both productions we made a pico file for further analysis. Cuts Used for making a pico file Previous Production New Production |D0Eta|<1.85 |Cos(θ*)<0.6 J. Joseph, UCLA")
32
3 rd Production

33
1 st Production

Similar presentations


 Hirschegg 2010, Austria Outline: Physics motivation >")


 University of Science and Technology of China (USTC) Brookhaven National Laboratory (BNL)>")


 Sarah LaPointe Wayne State University SVT review, BNL, July 7 th /8.>")


