Download presentation
Presentation is loading. Please wait.

1
Estimating the dose-toxicity curve from completed Phase I studies Alexia Iasonos, Irina Ostrovnaya Department of Biostatistics Memorial Sloan Kettering Cancer Center CRM Workshop, October 2009

2
Motivation 1.Retrospective analysis of completed Phase I studies in order to recommend, possibly, a new MTD among existing/visited dose levels, between dose levels

3
Example When tested levels are too low (safe), ie no activity Example for Extrapolation: Example for Interpolation Dose level 30 mg/m260 mg/m2120 mg/m2200 mg/m2 DLT/ # patients 0/3 1/6 Dose level 30 mg/m2 60 mg/m2 120 mg/m2 240 mg/m2 DLT/ # patients 0/3 1/63/3 or 2/2
, ie no activity Example for Extrapolation: Example for Interpolation Dose level 30 mg/m260 mg/m2120 mg/m2200 mg/m2 DLT/ # patients 0/3 1/6 Dose level 30 mg/m2 60 mg/m2 120 mg/m2 240 mg/m2 DLT/ # patients 0/3 1/63/3 or 2/2")
4
Motivation Cont. 2. Switching from 3+3 to adaptive design, how can we use toxicity data up to this point to add additional levels?

5
Statistical Question of Interest If we can fit a curve to the existing trial/data then this curve can be used to interpolate or possibly extrapolate. Dose-toxicity curve?

6
Available statistical methods for estimating the dose-response curve Parametric: probit or logit (Prentice 1976; He, 2006) sigmoid (Schmoyer 1984) Non-parametric: isotonic regression (Stylianou, 2003) Semi-parametric: splines or kernels (Kong 2006; Staniswalis 1988) PROBLEM: small sample size, 0 tox. at many dose levels; model assumptions; change point from concave to convex

7
Literature Review Can we use the Continual Reassessment Method (CRM) retrospectively? CRM uses toxicity data accumulated on all pts and updates a model that assigns the next patient to a dose that is closest to the target toxicity rate

8
CRM and retrospective CRM (retro-CRM) are not the same. Design (CRM) vs Analysis (retro-CRM)
 are not the same. Design (CRM) vs Analysis (retro-CRM)")
9
Can we use CRM retrospectively? O’ Quigley (2005) NO You had already followed another design so you can’t analyze the data assuming they were collected under the CRM scheme. Solution: if you weight the information obtained from toxicities at each dose, then you can use the retro-CRM methodology that accounts for the fact that CRM would have allocated pts/doses differently.
 NO You had already followed another design so you can’t analyze the data assuming they were collected under the CRM scheme. Solution: if you weight the information obtained from toxicities at each dose, then you can use the retro-CRM methodology that accounts for the fact that CRM would have allocated pts/doses differently..")
10
The weights are obtained by simulations and correspond to the percentage of patients CRM would have assigned to dose i. A large number of CRM trials of size are simulated using as the true toxicity rates, where are the observed toxicity rates from the existing trial. Weights depend on which CRM you use (cohorts or not)
.")
12
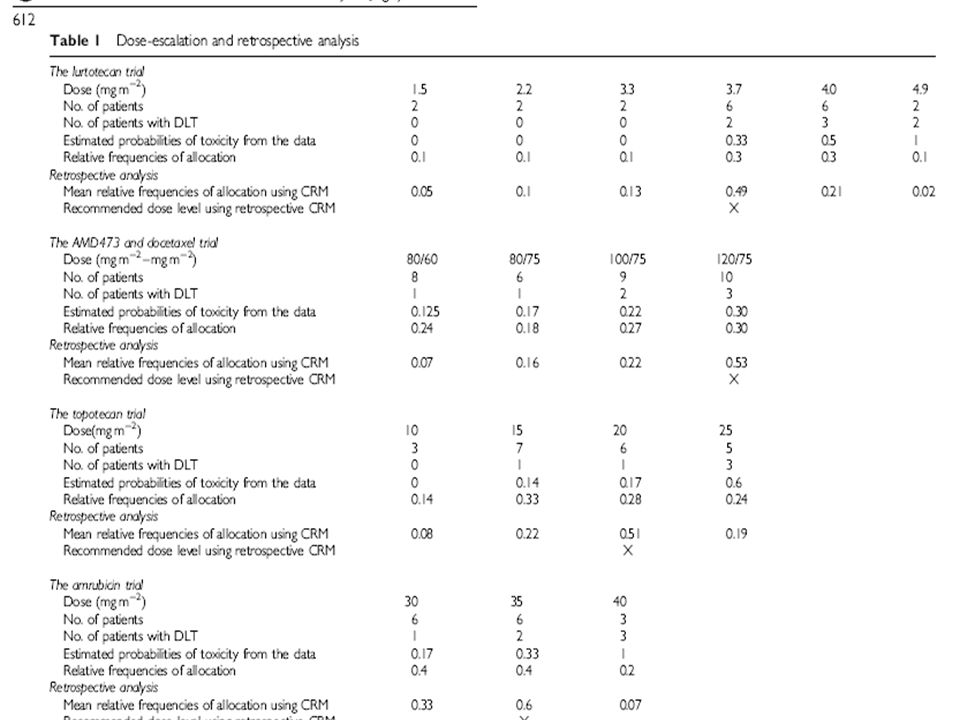
Message: The trials followed a modified 3+3 design; MTD not based on the 3+3 algorithm The two methods result in the same MTD but different patient/doses allocation ratio

13
Objective To estimate the dose-toxicity curve based on available data from a completed trial To evaluate the proposed method in 3+3 simulated trials, and compare it to retro-CRM

14
Constrained Maximum Likelihood Estimation (CMLE) There is no restriction on the toxicity rate at the first dose, p 1.
 There is no restriction on the toxicity rate at the first dose, p 1.")
15
Constrained Maximum Likelihood CMLE Use available data based on numerator and denominator separately, ie: 2/2, 3/3, or 6/6 has different implications We will have constraints as of how much can this curve increase between adjacent dose levels: – MIN= it has to increase by at least MIN value (useful at doses where we obtain no DLTs) – MAX= it cannot increase by more than MAX value (this downplays the 100% observed at last dose - often out of 1-2 pts, e.g. 1/1 or 2/2)
.")
16
Challenge: how to select MIN, MAX ? 5 levels, MIN=target rate at MTD/5=0.25/5=0.05 MAX=1/4=0.25

17
Constrained MLE Small values of MIN_value lead to a conservative estimation by favoring a flatter curve, while larger values of MIN impose larger jumps when the existing dose levels are low. Similarly, MAX_value controls toxic dose levels by constraining the curve from increasing radically when high toxicity rates are observed. The curve is between these bounds but the shape is not restricted by a model; only the observed toxicities at each dose, i.e. both the numerator and denominator count for the structure of the curve. Robust to the choice of MIN, MAX Fewer toxicities or pts then constrains matter Otherwise if available data are rich, constraints matter less

18
Simulations Simulated 1000 trials followed 3+3 design, testing 6, 5, 4 dose levels, target tox. rate=0.25 Compared MTD by: 1.Standard Method (SM) 2.CRM- not weighted (LCRM – O’ Quigley, Shen 1996) 3.Retrospective CRM (CRM-w; O’ Quigley 2005) 4.CMLE (with various MIN/MAX)
 2.CRM- not weighted (LCRM – O’ Quigley, Shen 1996) 3.Retrospective CRM (CRM-w; O’ Quigley 2005) 4.CMLE (with various MIN/MAX).")
19
Level0123456 True.01.05.1.15.2.25 SM<131017222126 CRM <1314273122 CRM _w 1214282922 New <1314273026

20
Level0123456 True.05.1.25.35.55.7 SM 394130153 CRM <142245254 CRM _w 152144273 New <142345254

21
012345NF True 0.050.100.150.200.30 SM 3921 2422 CRM <14132534213 CRM _w 15112533223 New <1413243525

22
012345NF True.15.25.3.4.5 SM 15342514616 CRM 922362481 CRM _w 1124322391<1 New 1423302391

23
01234NF True0.15.25.3.4 SM 1534261466 CRM 922362310<1 CRM_ w 1024322310<1 New 92037277

24
Additional Simulations (not shown) Under true toxicity rates that violate the constraints in increments between adjacent dose levels Under modified 3+3 trials that expanded accrual at MTD. If ≤ 3 toxicities were observed out of 10, then the MTD remained the same. Otherwise, the method de-escalated and followed the 3+3 scheme by expanding a cohort to 6 patients until ≥ 2 DLTs out of 6 patients were observed.

25
99-083: pralatrexate in combination with paclitaxel or docetaxel in adv solid tumors, doses 80P+35D,100/35,120/35 (2,16),120/35 (1,15), 120/35 (1,8,15), 140/35, MTD dose 4= 120 (1,15) other methods suggest dose 5, one level above MTD of the trial
,120/35 (1,15), 120/35 (1,8,15), 140/35, MTD dose 4= 120 (1,15) other methods suggest dose 5, one level above MTD of the trial")
26
01-021 Phase I study of an oral histone deacetylase inhibitor, suberoylanilide hydroxamic acid, in patients with advanced cancer. Oral SAHA, 200, 400, 600 mg qd or 400 mg bid after amend 200, 300 mg bid for solid tumors; Methods suggest 600, trial suggests 400

27
Phase I trial of the cyclin-dependent kinase inhibitor and protein kinase C inhibitor 7-hydroxystaurosporine in combination with Fluorouracil in patients with advanced solid tumors. Trial recommended 2600 which is the last dose CMLE recommends dose=7, retro-CRM recommends 4 th level, not weighted CRM recommends 5 th level

28
Confidence Intervals Estimation Wilson CI (Agresti, 1998): upper confidence limit u i for probability of toxicity p i
: upper confidence limit u i for probability of toxicity p i")
30
Average Width of 95% CI across dose levels All 95% CIs are conservative and have 99-100% coverage (across all dose levels) for all scenarios.
 for all scenarios.")
31
Confidence Intervals

32
Dose spacing – use of actual units

33
Quality assessment of Phase I dose-finding cancer trials – checklist (Zohar, Clinical Trials 2008)
")
34
Conclusion Rogatko (JCO 2007) : phase I rarely follow the 3+3. They follow a 3+3 scheme with “deviations” Since you deviate from the 3+3 you can’t assume that the statistical properties of 3+3 hold anymore. Not efficient use of data even if they followed 3+3 The proposed analysis method can estimate a retrospective MTD by analyzing the data that you obtained from this deviated scheme/design.

35
Acknowledgements Thank you to: Elyn Riedel – data collection Dr. Spriggs and other PIs of studies

Similar presentations


 Polymerase.>")

 = G( 0 + x ) y* = 0 + x + u, y = max(0,y*)>")


 Tests Chi-Square.>")