Download presentation
Presentation is loading. Please wait.

1
LAGB in low BMI patients Jaime Ponce MD FACS FASMBS Dalton GA MISS Salt Lake City UT February 24, 2012

2
Disclosures Allergan: speaker, proctor, consultant, research Ethicon: teaching Vibrynt: consultant ReShape: research, consultant Cavu Medical: consultant 2

3
Obesity Incidence of obesity in the U.S. - National Health and Nutrition Examination Survey (NHANES): – BMI > 30: 34% population in the U.S. 1 – BMI > 35: 14% population in the U.S. 1 1 Flegal: JAMA 2010;303:235
: – BMI > 30: 34% population in the U.S. 1 – BMI > 35: 14% population in the U.S. 1 1 Flegal: JAMA 2010;303:235.")
4
Obesity Class I Class I Obesity is a health problem: – 30% greater mortality 1 – 3 yrs decrease in lifespan 1 1 Prospective Studies Collaboration. Body-mass index and cause-specific mortality in 900,000 adults: collaborative analyses of 57 prospective studies. Lancet 2009;373:1083-1096.

5
Obesity Class I Disease Prevalence (NHANES): – Type 2 DM increase 3-fold – HTN increase > 2-fold – Dyslipidemia > 2-fold
: – Type 2 DM increase 3-fold – HTN increase > 2-fold – Dyslipidemia > 2-fold")
6
Medical Therapy Non-surgical therapy is not effective in the majority 1 1 Svetkey LP, Stevens VJ, Brantley PJ, et al. Comparison of strategies for sustaining weight loss: the weight loss maintenance randomized controlled trial. JAMA 2008;299(10):1139-1148.
:")
7
Literature: Low BMI LAGB data Angrisani, et al (2004) Parikh, et al (2006) O’Brien, et al (2006) Dixon, et al (2008) Sultan, et al (2009) Choi, et al (2010) BOLD data (2010) Lap-Band ® FDA study (2010)
 Parikh, et al (2006) O’Brien, et al (2006) Dixon, et al (2008) Sultan, et al (2009) Choi, et al (2010) BOLD data (2010) Lap-Band ® FDA study (2010)")
8
Italian Group for Lap-Band System ® : Results of Multicenter Study on Patients with BMI < 35 kg/m2 Angrisani, Favretti, et al (Italian Group for Lap-Band ® ) Obesity Surgery, 14, 415-418 (2004) 27 centers BMI < 35 pts: 210 (6.3%) out of 3,319 LAGB pts Female N=176 (84%) Mean age: 38+12 (17-66) Mean BMI: 33.9+1.1 (25.1-35)
 Obesity Surgery, 14, (2004) 27 centers BMI < 35 pts: 210 (6.3%) out of 3,319 LAGB pts Female N=176 (84%) Mean age: (17-66) Mean BMI: ( )")
9
Italian Group for Lap-Band System ® : Results of Multicenter Study on Patients with BMI < 35 kg/m2 Angrisani, Favretti, et al (Italian Group for Lap-Band ® ) Obesity Surgery, 14, 415-418 (2004)
 Obesity Surgery, 14, (2004)")
10
FU (month s) %EWL 628.1±2 0.7 1252.5±1 3.2 2461.3±1 4.7 3664.7±1 2.2 4868.8±1 5.3 6071.9±1 0.7
 %EWL 628.1± ± ± ± ± ±1 0.7")
11
Italian Group for Lap-Band System ® : Results of Multicenter Study on Patients with BMI < 35 kg/m2 Angrisani, Favretti, et al (Italian Group for Lap-Band ® ) Obesity Surgery, 14, 415-418 (2004)
 Obesity Surgery, 14, (2004)")
12
Laparoscopic adjustable gastric banding for patients with body mass index of <35 kg/m 2 Parikh, Duncombe and Fielding (NYU/Brisbane, Australia) Surgery for Obesity and Related Diseases 2 (2006) 518–522 N=93 pts (1996-2004) 2 centers Age 44.6 (16-76) BMI 32.7 (30-34)
 Surgery for Obesity and Related Diseases 2 (2006) 518–522 N=93 pts ( ) 2 centers Age 44.6 (16-76) BMI 32.7 (30-34)")
13
LAGB patients with BMI < 35 kg/m 2 Parikh, Duncombe and Fielding (NYU/Brisbane, Australia) Surgery for Obesity and Related Diseases 2 (2006) 518–522
 Surgery for Obesity and Related Diseases 2 (2006) 518–522")
15
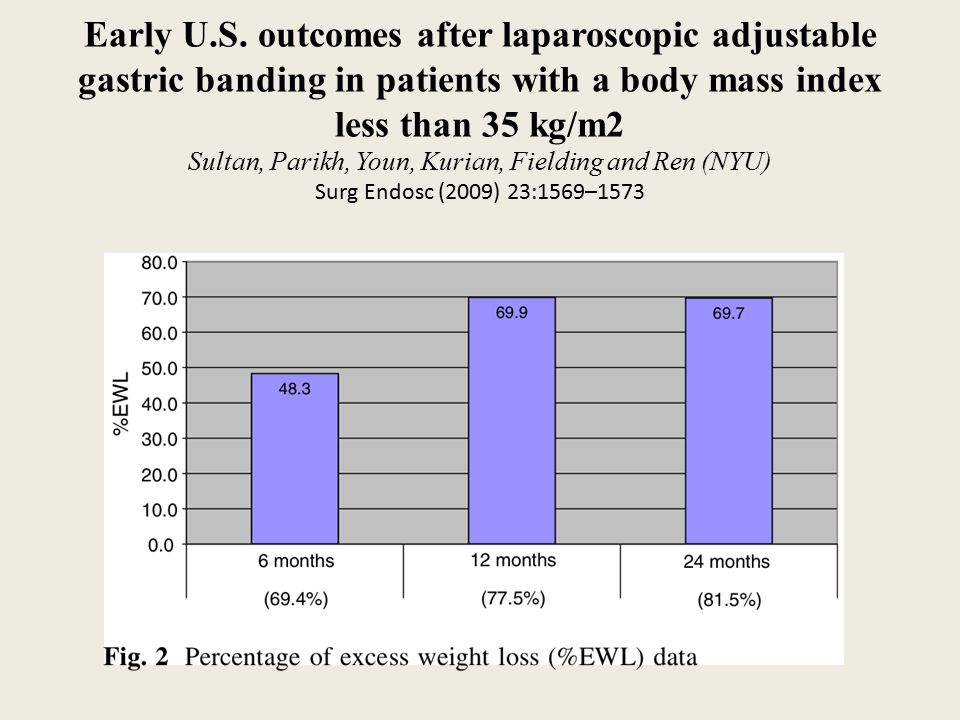
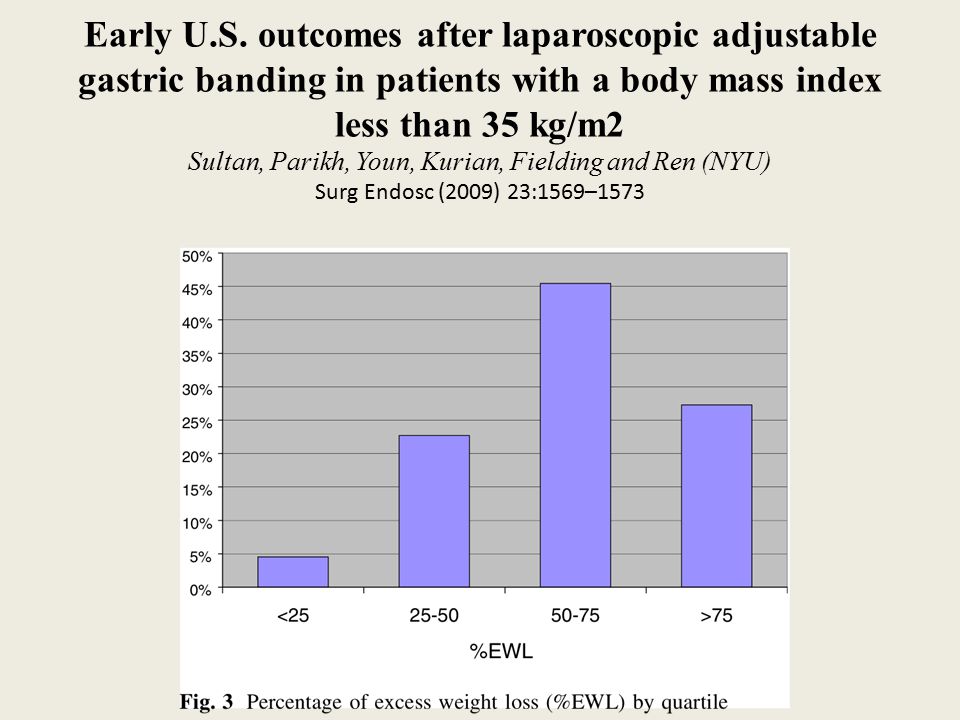
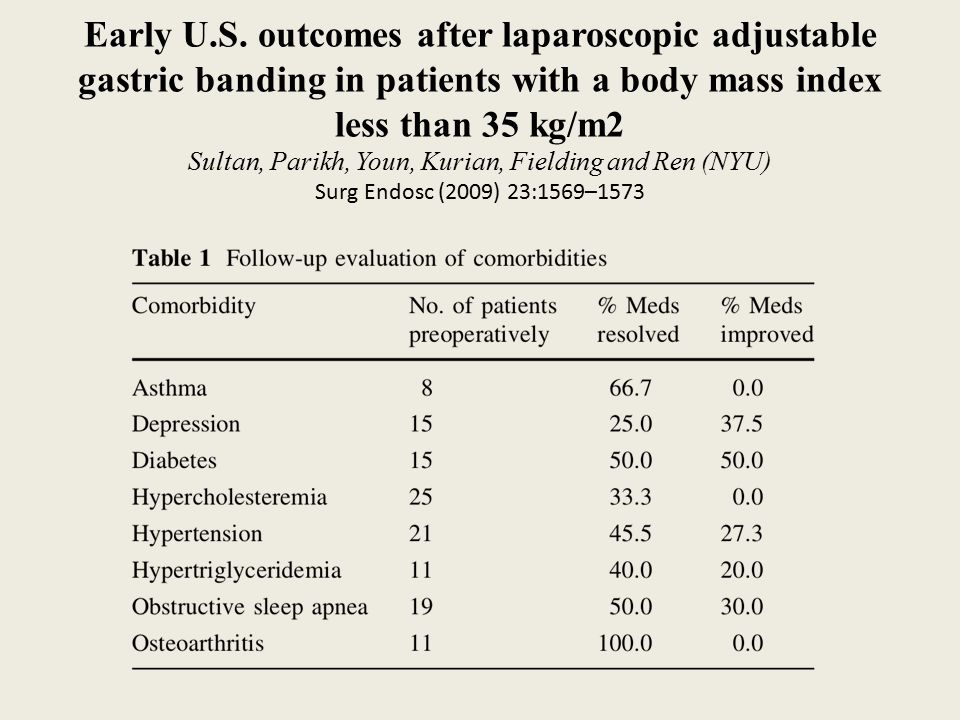
Early U.S. outcomes after laparoscopic adjustable gastric banding in patients with a body mass index less than 35 kg/m2 Sultan, Parikh, Youn, Kurian, Fielding and Ren (NYU) Surg Endosc (2009) 23:1569–1573 N=53 pts 2002-2007 Age 46.9 (16-68) BMI 33.1 (28.2-35)
 Surg Endosc (2009) 23:1569–1573 N=53 pts Age 46.9 (16-68) BMI 33.1 ( ).")
16
Early U.S. outcomes after laparoscopic adjustable gastric banding in patients with a body mass index less than 35 kg/m2 Sultan, Parikh, Youn, Kurian, Fielding and Ren (NYU) Surg Endosc (2009) 23:1569–1573
 Surg Endosc (2009) 23:1569–1573.")
21
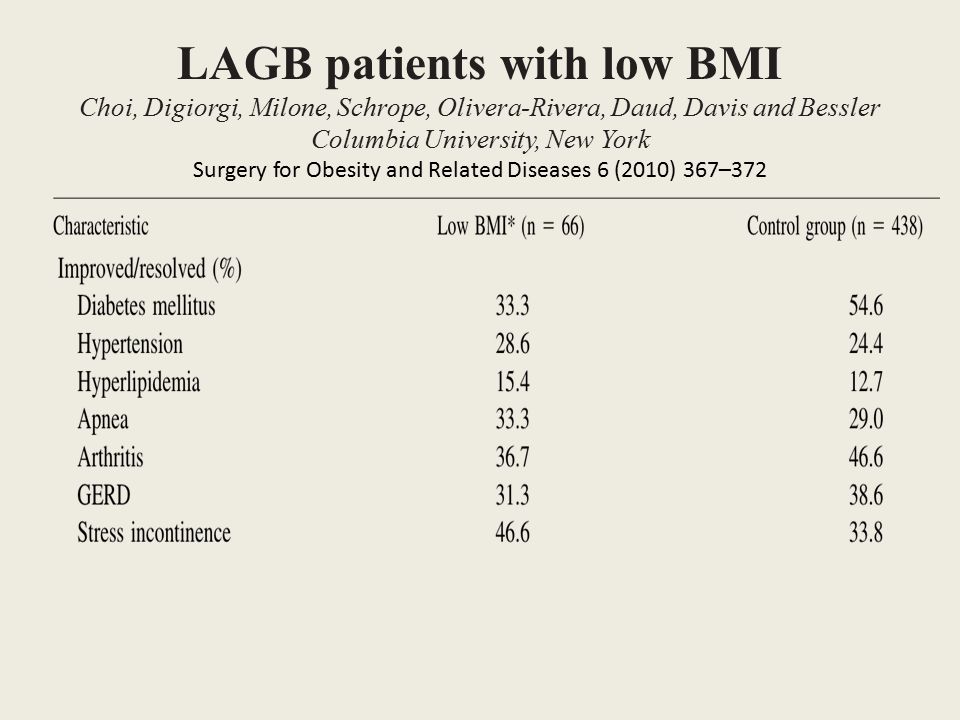
Outcomes of laparoscopic adjustable gastric banding in patients with low body mass index Choi, Digiorgi, Milone, Schrope, Olivera-Rivera, Daud, Davis and Bessler Columbia University, New York Surgery for Obesity and Related Diseases 6 (2010) 367–372 N=66 pts: – 22 pts (BMI 30-35 w/comorbidities) – 44 pts (BMI 35-40 w/o comorbidities) Control N=438 pts (NIH guidelines) BMI 36.1+2.6 vs 46+7.3 Age 40.7 vs 43.7 Female (%): 89.4 vs 72.9
 367–372 N=66 pts: – 22 pts (BMI w/comorbidities) – 44 pts (BMI w/o comorbidities) Control N=438 pts (NIH guidelines) BMI vs Age 40.7 vs 43.7 Female (%): 89.4 vs 72.9")
22
LAGB patients with low BMI Choi, Digiorgi, Milone, Schrope, Olivera-Rivera, Daud, Davis and Bessler Columbia University, New York Surgery for Obesity and Related Diseases 6 (2010) 367–372
 367–372")
24
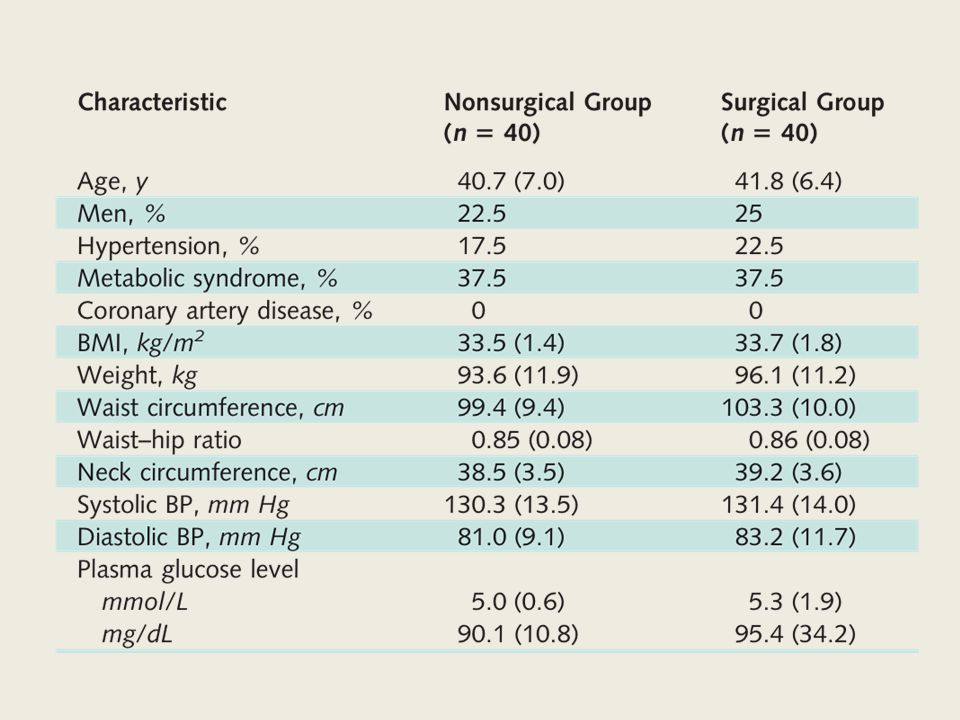
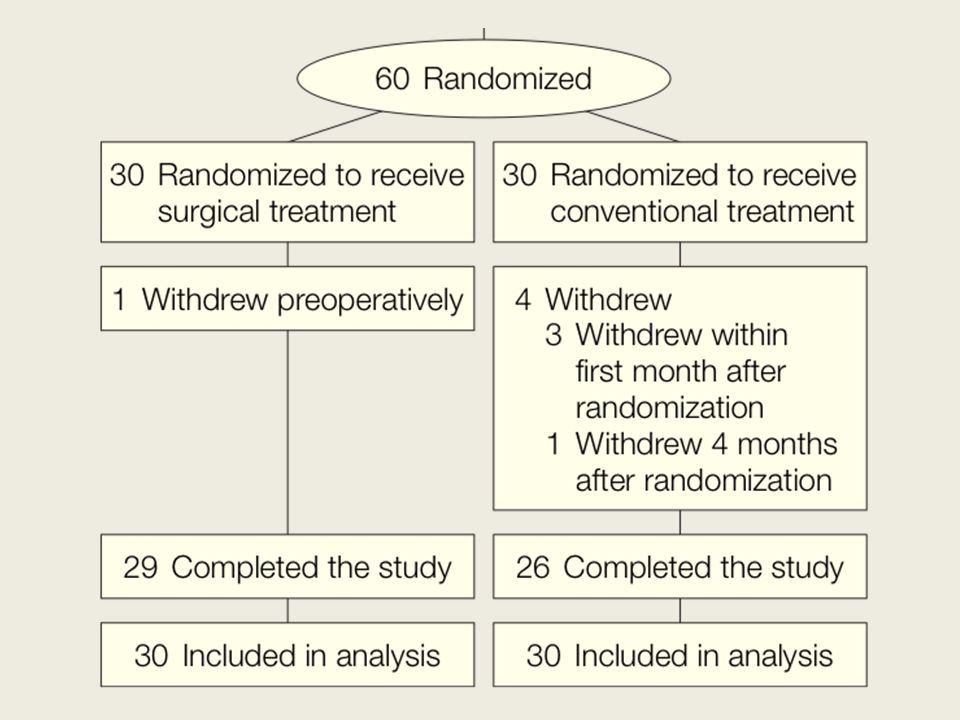
THE MANAGEMENT OF OBESITY A PROSPECTIVE RANDOMISED CONTROLLED TRIAL OF MEDICAL VERSUS SURGICAL THERAPY Paul O’Brien,. Paul O’Brien, John Dixon, Cheryl Laurie, Stewart Skinner, Joe Proietto, John McNeil, Boyd Strauss, Sharon Marks, Linda Schachter, Leon Chapman and Margaret Anderson. Centre for Obesity Research and Education Monash University, Melbourne, Australia Annals of Internal Medicine, May, 2006

27
RCT of Medical vs Surgical Therapy for Obesity % of Excess Weight Lost 87 87 % 21%

28
Effect on Metabolic Syndrome RCT of Medical vs Surgical Therapy for Obesity Effect on Metabolic Syndrome N.S. P < 0.001 % 38% 24% 38% 3% Surgical Change vs Medical Change P < 0.006

30
The Management of Type-2 Diabetes A Randomized Controlled Trial of Surgical and Non-surgical Therapy The Management of Type-2 Diabetes A Randomized Controlled Trial of Surgical and Non-surgical Therapy John B. Dixon, Paul E. O'Brien, Julie Playfair, Stewart Skinner, Joseph Proietto, Linda M Schachter, Leon Chapman, Margaret Anderson Centre for Obesity Research and Education Monash University, Melbourne JAMA, Feb, 2008

33
Type-2 Diabetes – A Randomised Trial Weight Loss - % of excess weight lost 65 65 % 6%

34
Type 2 Diabetes – A Randomised Trial Weight Loss – Change in BMI 36.3 28.4 37.1

35
Type 2 Diabetes – A Randomised Trial Remission of Diabetes - ITT 73% 13%

36
Type-2 Diabetes – A Randomised Trial Effect on Metabolic Syndrome (ATP III criteria) (N.S.) P < 0.001 % 97% 88% 97% 28% Non-surgical vs Surgical Change P < 0.001
 (N.S.) P < % 97% 88% 97% 28% Non-surgical vs Surgical Change P < 0.001")
39
Methods 66,264 research-consented BOLD patients 794 (1.2%)had BMI 30-34.9 kg/m 2 235 (29%) diabetes requiring any medication – LAGB 109 – RNY109 – SG7 – BPD1
had BMI kg/m (29%) diabetes requiring any medication – LAGB 109 – RNY109 – SG7 – BPD1")
40
Baseline Characteristics of the Population N%P Gender Female Male 180 55 76.6 23.4 0.3476 Race White African-American Other 189 20 26 80.4 8.5 11.1 0.5695

41
Complications

42
Band data N=109 Preop BMI 33.9 (+1.1) kg/m 2 %EBW 57.9 (+7.8) lbs Total # T2DM meds: 1.3 (+1.1) 38.5% off meds in 3-6 months BMI change: 33.9 to 29.9
 kg/m 2 %EBW 57.9 (+7.8) lbs Total # T2DM meds: 1.3 (+1.1) 38.5% off meds in 3-6 months BMI change: 33.9 to 29.9")
43
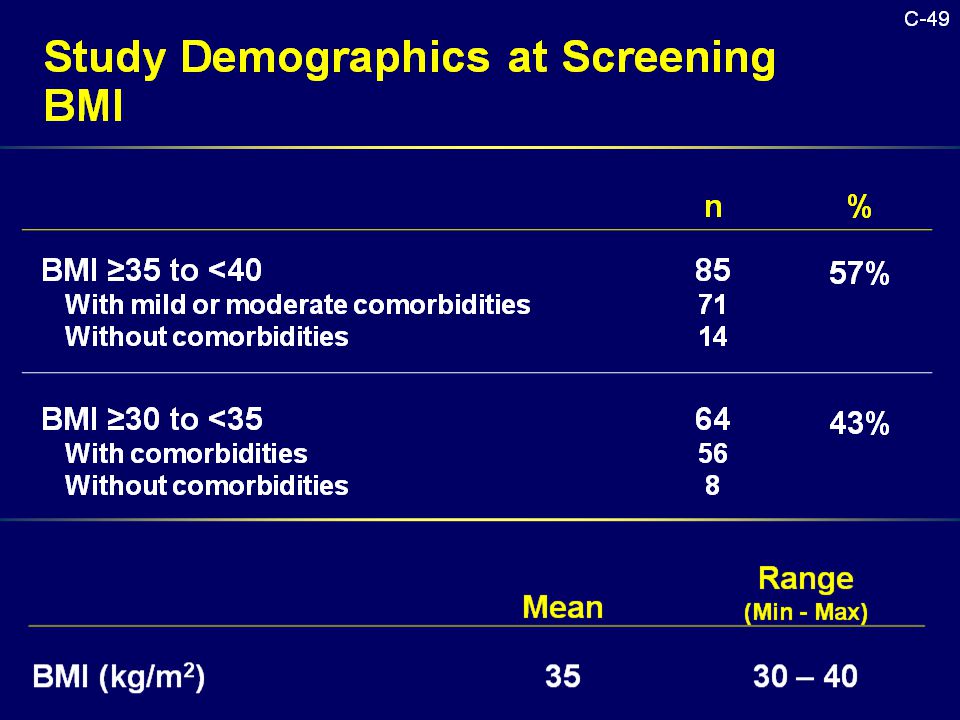
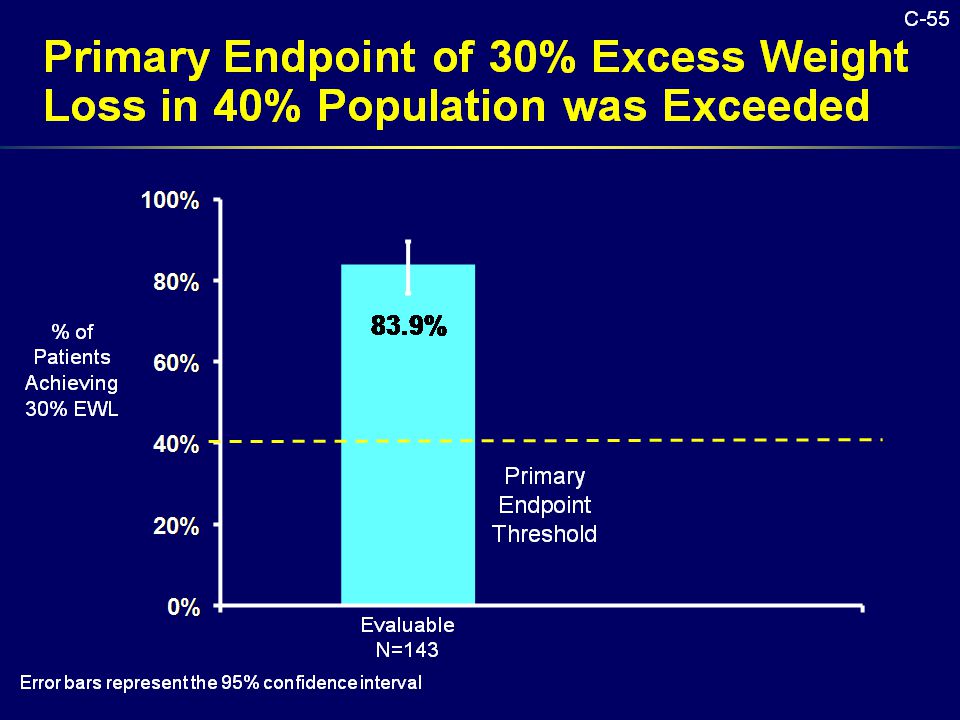
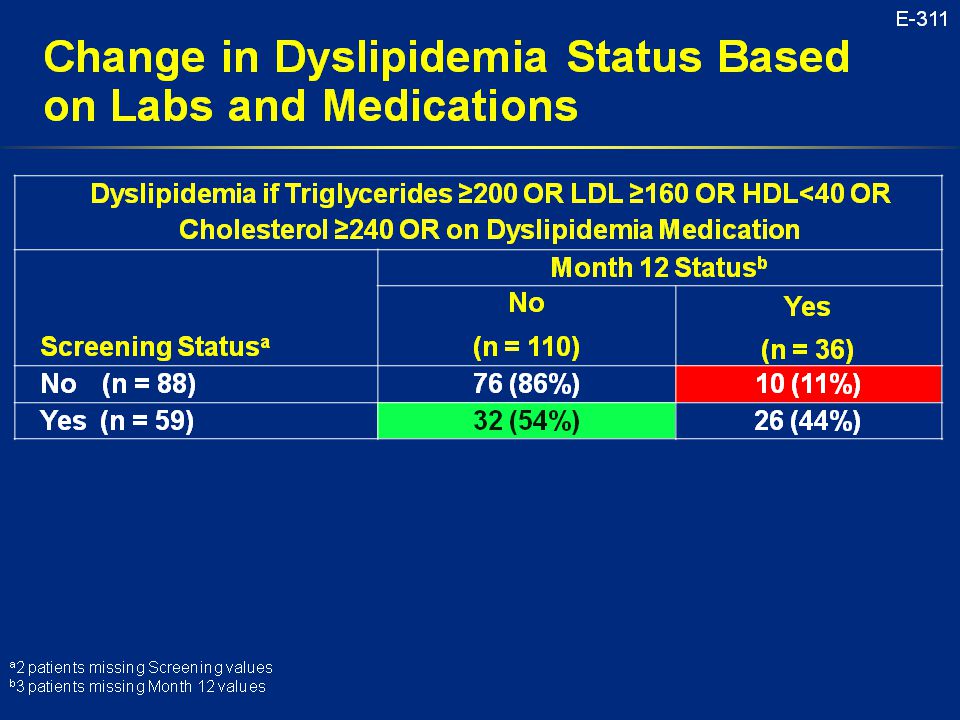
FDA Clinical Study of LAP-BAND ® in BMI ≥ 30 and < 40 kg/m 2 FDA panel Dec 3, 2010

58
Change in Hypertension Status from Screening to Month 12

69
FDA Panel Voted 8-2 in favor: – Safe – Effective – Benefits outweight risks

70
LAGB Low BMI Data Summary StudyType of StudyBMI Baseline BMI Final %EWLDurationN Angrisani et al Retrospective, Multicenter 33.928.271.9%5 yrs210 Choi et al Prospective Case Control 36.1N/A42.2%1.5 yrs66 Dixon et al Randomized Controlled Trial 36.929.562.5%2 yrs30 O’Brien et al Randomized Controlled Trial 33.726.487.2%2 yrs40 Parikh et al Prospective, Single Center 32.727.653.8%3 yrs93 Sultan et al Prospective, Single Center 33.125.869.7%2 yrs53 FDA Study Prospective, Multicenter 35.428.864.5%1 yrs143

71
Conclusions LAGB in Low BMI patients: – Safe – Effective – Improves comorbidities/QOL LAGB benefits outweight risk in low BMI patients

Similar presentations


 Surgery for Life-Long Weight Control and Mortality Risk Reduction First Canadian Summit on Surgery for T2DM May 6, 2010 Montreal,>")

 describes relative weight for height: weight (kg)/height (m 2 ) Overweight = 25–29.9 BMI Obesity = >30 BMI.>")


 Chen, MD, PhD Pediatric Prevention Research Center>")


