Download presentation
Presentation is loading. Please wait.

1
Discrete Choice Modeling William Greene Stern School of Business New York University Lab Sessions

2
Lab Session 4 Bivariate Extensions of the Probit Model

3
Bivariate Probit Model Two equation model General usage of LHS = the set of dependent variables RH1 = one set of independent variables RH2 = a second set of variables Economical use of namelists is useful here Namelist ; x1=one,age,female,educ,married,working $ Namelist ; x2=one,age,female,hhninc,hhkids $ BivariateProbit ;lhs=doctor,hospital ;rh1=x1 ;rh2=x2;marginal effects $

4
Heteroscedasticity in the Bivariate Probit Model General form of heteroscedasticity in LIMDEP/NLOGIT: Exponential σ i = σ exp(γ’z i ) so that σ i > 0 γ = 0 returns the homoscedastic case σ i = σ Easy to specify Namelist ; x1=one,age,female,educ,married,working ; z1 = … $ Namelist ; x2=one,age,female,hhninc,hhkids ; z2 = … $ BivariateProbit ;lhs=doctor,hospital ;rh1=x1 ; hf1 = z1 ;rh2=x2 ; hf2 = z2$
 so that σ i > 0 γ = 0 returns the homoscedastic case σ i = σ Easy to specify Namelist ; x1=one,age,female,educ,married,working ; z1 = … $ Namelist ; x2=one,age,female,hhninc,hhkids ; z2 = … $ BivariateProbit ;lhs=doctor,hospital ;rh1=x1 ; hf1 = z1 ;rh2=x2 ; hf2 = z2$")
5
Heteroscedasticity in Marginal Effects Univariate case: If the variables are the same in x and z, these terms are added. Sign and magnitude are ambiguous Vastly more complicated for the bivariate probit case. NLOGIT handles it internally.

6
Marginal Effects: Heteroscedasticity +------------------------------------------------------+ | Partial Effects for Ey1|y2=1 | +----------+---------------------+---------------------+ | | Regression Function | Heteroscedasticity | | +---------------------+---------------------+ | | Direct | Indirect | Direct | Indirect | | Variable | Efct x1 | Efct x2 | Efct h1 | Efct h2 | +----------+----------+----------+----------+----------+ | AGE |.00190 | -.00012 |.00000 |.00000 | | FEMALE |.10215 |.20688 | -.05880 | -.30944 | | EDUC | -.00247 |.00000 |.00000 |.00000 | | MARRIED |.00103 |.00000 |.00064 |.00476 | | WORKING | -.02139 |.00000 |.00000 |.00000 | | HHNINC |.00000 |.00154 |.00000 |.00000 | | HHKIDS |.00000 |.00005 |.00000 |.00000 | +----------+----------+----------+----------+----------+

7
Marginal Effects: Total Effects +-------------------------------------------+ | Partial derivatives of E[y1|y2=1] with | | respect to the vector of characteristics. | | They are computed at the means of the Xs. | | Effect shown is total of 4 parts above. | | Estimate of E[y1|y2=1] =.819898 | | Observations used for means are All Obs. | | Total effects reported = direct+indirect. | +-------------------------------------------+ +---------+--------------+----------------+--------+---------+----------+ |Variable | Coefficient | Standard Error |b/St.Er.|P[|Z|>z] | Mean of X| +---------+--------------+----------------+--------+---------+----------+ Constant.000000......(Fixed Parameter)....... AGE.00347726.00022941 15.157.0000 43.5256898 FEMALE.08021863.00535648 14.976.0000.47877479 EDUC -.00392413.00093911 -4.179.0000 11.3206310 MARRIED.00061108.00506488.121.9040.75861817 WORKING -.02280671.00518908 -4.395.0000.67704750 HHNINC.00216510.00374879.578.5636.35208362 HHKIDS.00034768.00164160.212.8323.40273000
![Marginal Effects: Total Effects | Partial derivatives of E[y1|y2=1] with | | respect to the vector of characteristics.](http://images.slideplayer.com/11/3268676/slides/slide_7.jpg "| | They are computed at the means of the Xs. | | Effect shown is total of 4 parts above. | | Estimate of E[y1|y2=1] = | | Observations used for means are All Obs. | | Total effects reported = direct+indirect. | |Variable | Coefficient | Standard Error |b/St.Er.|P[|Z|>z] | Mean of X| Constant (Fixed Parameter) AGE FEMALE EDUC MARRIED WORKING HHNINC HHKIDS")
8
Imposing Fixed Value and Equality Constraints Used throughout LIMDEP in all models, model parameters appear as a long list: β 1 β 2 β 3 β 4 α 1 α 2 α 3 α 4 σ and so on. M parameters in total. Use ; RST = list of symbols for the model parameters, in the right order This may be used for nonlinear models. Not in REGRESS. Use ;CLS:… for linear models Use the same name for equal parameters Use specific numbers to fix the values

9
BivariateProbit ; lhs=doctor,hospital ; rh1=one,age,female,educ,married,working ; rh2=one,age,female,hhninc,hhkids ; rst = beta1,beta2,beta3,be,bm,bw, beta1,beta2,beta3,bi,bk, 0.4 $ --------+------------------------------------------------------------- Variable| Coefficient Standard Error b/St.Er. P[|Z|>z] Mean of X --------+------------------------------------------------------------- |Index equation for DOCTOR Constant| -1.69181***.08938 -18.928.0000 AGE|.01244***.00167 7.440.0000 44.3352 FEMALE|.38543***.03157 12.209.0000.42277 EDUC|.08144***.00457 17.834.0000 10.9409 MARRIED|.42021***.03987 10.541.0000.84539 WORKING|.03310.03910.847.3972.73941 |Index equation for HOSPITAL Constant| -1.69181***.08938 -18.928.0000 AGE|.01244***.00167 7.440.0000 44.3352 FEMALE|.38543***.03157 12.209.0000.42277 HHNINC| -.98617***.08917 -11.060.0000.34930 HHKIDS| -.09406**.04600 -2.045.0409.45482 |Disturbance correlation RHO(1,2)|.40000......(Fixed Parameter)...... --------+-------------------------------------------------------------
| (Fixed Parameter)")
10
Miscellaneous Topics Two Step Estimation Robust (Sandwich) Covariance matrix Matrix Algebra – Testing for Normality
 Covariance matrix Matrix Algebra – Testing for Normality")
11
Two Step Estimation

12
Murphy and Topel This can usually easily be programmed using the models, CREATE, CALC and MATRIX. Several leading cases are built in.

13
Two Step Estimation: Automated

14
Application: Recursive Probit Hospital = bh ’ xh + c*Doctor + eh Doctor = bd ’ xd + ed Sample ; All $ Namelist ; xD=one,age,female,educ,married,working ; xH=one,age,female,hhninc,hhkids $ Reject ; _Groupti < 7 $ Probit ; lhs=hospital;rhs=xh,doctor$ Probit ; lhs=doctor;rhs=xd;prob=pd;hold$ Probit ; lhs=hospital;rhs=xh,pd;2step=pd$

15
Robust Covariance Matrix

16
; ROBUST Using the health care data: +---------------------------------------------+ | Binomial Probit Model | +---------------------------------------------+ +---------+--------------+----------------+--------+---------+ |Variable | Coefficient | Standard Error |b/St.Er.|P[|Z|>z] | +---------+--------------+----------------+--------+---------+ |Index function for probability Constant| -.17336***.05874 -2.951.0032 AGE|.01393***.00074 18.920.0000 43.5257 FEMALE|.32097***.01718 18.682.0000.47877 EDUC| -.01602***.00344 -4.650.0000 11.3206 MARRIED| -.00153.01869 -.082.9347.75862 WORKING| -.09257***.01893 -4.889.0000.67705 Robust VC= G used for estimates. Constant| -.17336***.05881 -2.948.0032 AGE|.01393***.00073 19.024.0000 43.5257 FEMALE|.32097***.01701 18.869.0000.47877 EDUC| -.01602***.00345 -4.648.0000 11.3206 MARRIED| -.00153.01874 -.082.9348.75862 WORKING| -.09257***.01885 -4.911.0000.67705
![; ROBUST Using the health care data: | Binomial Probit Model | |Variable | Coefficient | Standard Error |b/St.Er.|P[|Z|>z] | |Index function for probability Constant| *** AGE|.01393*** FEMALE|.32097*** EDUC| *** MARRIED| WORKING| *** Robust VC= G used for estimates.](http://images.slideplayer.com/11/3268676/slides/slide_16.jpg "Constant| *** AGE|.01393*** FEMALE|.32097*** EDUC| *** MARRIED| WORKING| ***")
17
Cluster Correction PROBIT ; Lhs = doctor ; Rhs = one,age,female,educ,married,working ; Cluster = ID $ Normal exit: 4 iterations. Status=0. F= 17448.10 +---------------------------------------------------------------------+ | Covariance matrix for the model is adjusted for data clustering. | | Sample of 27326 observations contained 7293 clusters defined by | | variable ID which identifies by a value a cluster ID. | +---------------------------------------------------------------------+ Variable| Coefficient Standard Error b/St.Er. P[|Z|>z] Mean of X --------+------------------------------------------------------------- |Index function for probability Constant| -.17336**.08118 -2.135.0327 AGE|.01393***.00102 13.691.0000 43.5257 FEMALE|.32097***.02378 13.497.0000.47877 EDUC| -.01602***.00492 -3.259.0011 11.3206 MARRIED| -.00153.02553 -.060.9521.75862 WORKING| -.09257***.02423 -3.820.0001.67705 --------+-------------------------------------------------------------

18
Using Matrix Algebra Namelists with the current sample serve 2 major functions: (1) Define lists of variables for model estimation (2) Define the columns of matrices built from the data. NAMELIST ; X = a list ; Z = a list … $ Set the sample any way you like. Observations are now the rows of all matrices. When the sample changes, the matrices change. Lists may be anything, may contain ONE, may overlap (some or all variables) and may contain the same variable(s) more than once
 and may contain the same variable(s) more than once.")
19
Matrix Functions Matrix Product: MATRIX ; XZ = X ’ Z $ Moments and Inverse MATRIX ; XPX = X ’ X ; InvXPX = $ Moments with individual specific weights in variable w. Σ i w i x i x i ’ = X ’ [w]X. [Σ i w i x i x i ’ ] -1 = Unweighted Sum of Rows in a Matrix Σ i x i = 1 ’ X Column of Sample Means (1/n) Σ i x i = 1/n * X ’ 1 or MEAN(X) (Matrix function. There are over 100 others.) Weighted Sum of rows in matrix Σ i w i x i = 1 ’ [w]X
 Σ i x i = 1/n * X ’ 1 or MEAN(X) (Matrix function. There are over 100 others.) Weighted Sum of rows in matrix Σ i w i x i = 1 ’ [w]X.")
20
Normality Test for Probit Thanks to Joachim Wilde, Univ. Halle, Germany for suggesting this.

21
Normality Test for Probit NAMELIST ; XI = One,... $ CREATE ; yi = the dependent variable $ PROBIT ; Lhs = yi ; Rhs = Xi ; Prob = Pfi $ CREATE ; bxi = b'Xi ; fi = N01(bxi) $ CREATE ; zi3 = -1/2*(bxi^2 - 1) ; zi4 = 1/4*(bxi*(bxi^2+3)) $ NAMELIST ; Zi = Xi,zi3,zi4 $ CREATE ; di = fi/sqr(pfi*(1-pfi)) ; ei = yi - pfi ; eidi = ei*di ; di2 = di*di $ MATRIX ; List ; LM = 1'[eidi]Zi * * Zi'[eidi]1 $
 $ CREATE ; zi3 = -1/2*(bxi^2 - 1) ; zi4 = 1/4*(bxi*(bxi^2+3)) $ NAMELIST ; Zi = Xi,zi3,zi4 $ CREATE ; di = fi/sqr(pfi*(1-pfi)) ; ei = yi - pfi ; eidi = ei*di ; di2 = di*di $ MATRIX ; List ; LM = 1 [eidi]Zi * * Zi [eidi]1 $.")
22
Multivariate Probit MPROBIT ; LHS = y1,y2, …,yM ; Eq1 = RHS for equation 1 ; Eq2 = RHS for equation 2 … ; EqM = RHS for equation M $ Parameters are the slope vectors followed by the lower triangle of the correlation matrix

23
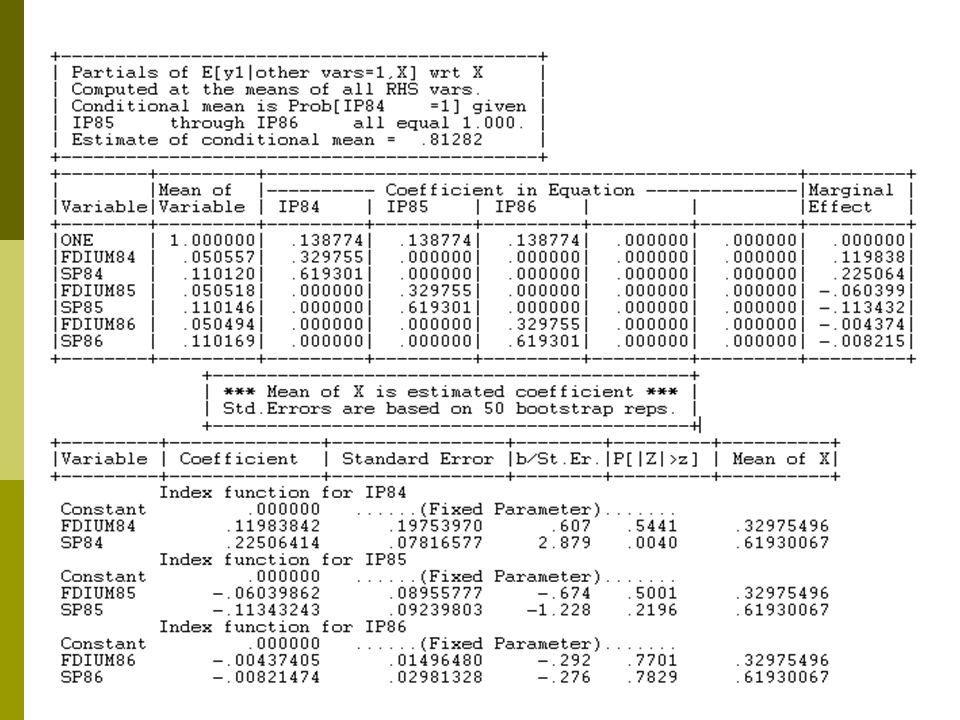
Constrained Panel Probit Sample ; 1 - 1270 $ MPROBIT ; LHS = IP84, IP85, IP86 ; MarginalEffects ; Eq1 = One,Fdium84,SP84 ; Eq2 = One,Fdium85,SP85 ; Eq3 = One,Fdium86,SP86 ; Rst = b1,b2,b3,b1,b2,b3,b1,b2,b3,r45, r46, r56 ; Maxit = 3 ; Pts = 15 $ (Reduces time to compute)
")
24
Estimated Multivariate Probit +---------------------------------------------+ | Multivariate Probit Model: 3 equations. | | Number of observations 1270 | | Log likelihood function -2423.732 | | Number of parameters 6 | | Replications for simulated probs. = 15 | +---------------------------------------------+ +---------+--------------+----------------+--------+---------+----------+ |Variable | Coefficient | Standard Error |b/St.Er.|P[|Z|>z] | Mean of X| +---------+--------------+----------------+--------+---------+----------+ Index function for IP84 Constant.13489406.03467525 3.890.0001 FDIUM84.33571101.47118274.712.4762.05055702 SP84.65662961.13801209 4.758.0000.11012047 Index function for IP85 Constant.13489406.03467525 3.890.0001 FDIUM85.33571101.47118274.712.4762.05051809 SP85.65662961.13801209 4.758.0000.11014611 Index function for IP86 Constant.13489406.03467525 3.890.0001 FDIUM86.33571101.47118274.712.4762.05049439 SP86.65662961.13801209 4.758.0000.11016926 Correlation coefficients R(01,02).46759312.03716428 12.582.0000 R(01,03).37251014.03946383 9.439.0000 R(02,03).46215054.03721312 12.419.0000
 R(01,03) R(02,03)")
26
Endogenous Variable in Probit Model PROBIT ; Lhs = y1, y2 ; Rh1 = rhs for the probit model,y2 ; Rh2 = exogenous variables for y2 $ SAMPLE ; All $ CREATE ; GoodHlth = Hsat > 5 $ PROBIT ; Lhs = GoodHlth,Hhninc ; Rh1 = One,Female,Hhninc ; Rh2 = One,Age,Educ $

Similar presentations


![[Part 1] 1/15 Discrete Choice Modeling Econometric Methodology Discrete Choice Modeling William Greene Stern School of Business New York University 0Introduction.](/14/4238540/big_thumb.jpg "[Part 1] 1/15 Discrete Choice Modeling Econometric Methodology Discrete Choice Modeling William Greene Stern School of Business New York University 0Introduction.>")


