Download presentation
Presentation is loading. Please wait.

1
Estimating Total Cost for A Single Product
Example 16.2 Estimating Total Cost for A Single Product

2
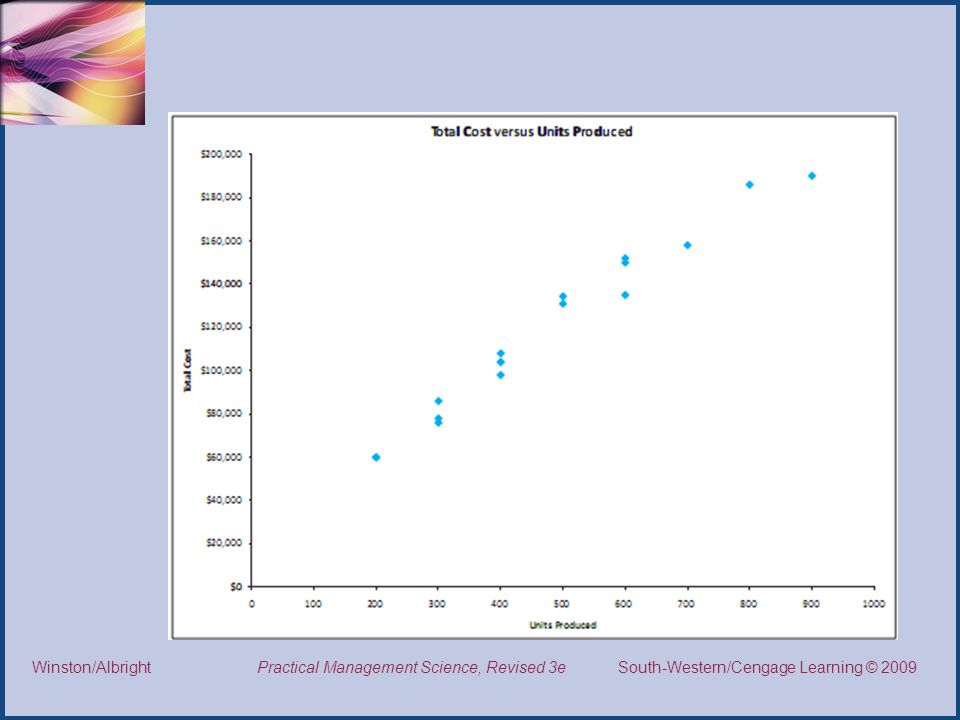
Cost Regression 1.xlsx Consider a company that produces a single product. For each of the past 16 months, the company has kept track of the number of units produced as well as the total cost of production. These data are shown on the next slide and in the file CostRegression1.xls. What can simple regression tell us about the relationship between these two variables? How can it be used to predict future production costs?

4
Solution When we try to relate two variables with regression, it is always a good idea to create a scatterplot of the two variables first, just to see whether there is any relationship worth pursuing. This can be done with Excel’s Chart Wizard in the usual way, which leads to the scatterplot shown on the next slide. This plot indicates a clear linear relationship, where Total Cost increases linearly as Units Produced increases.

6
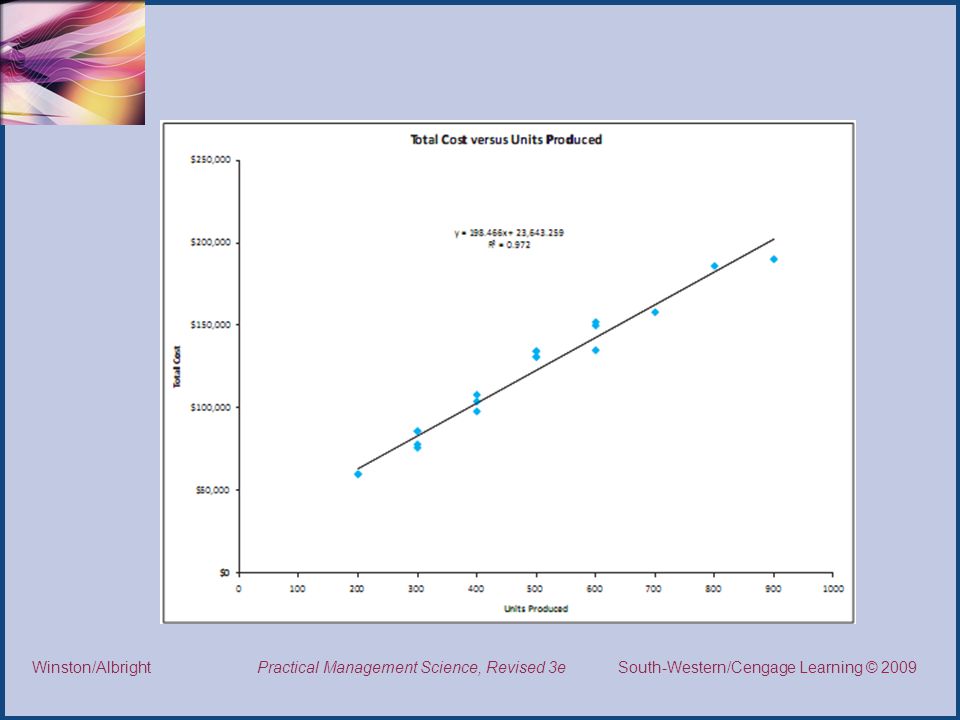
Solution -- continued We can now fit a straight line to this plot using Excel’s Trendline tool. The results appear on the next slide. The equation of the straight line has a slope, , and an intercept, 23,643. For this example, both numbers have a natural interpretation. The slope corresponds to the unit variable cost of production. We estimate that each extra unit produced contributes $ to total cost. The intercept corresponds to the fixed cost of production. We estimate that the fixed cost is $23,643, regardless of the production level.

8
Solution -- continued We can now find the fitted values, the residuals, and the standard error of estimate. The results appear on the next slide. We first insert the intercept and slope values from the chart in cells F2 and F3. To get the fitted values for any months, we substitute into the regression equation. To do this, enter the formula =$F$2+$F$3*B2 in cell H2 and copy it down to cell H19.

10
Solution -- continued To calculate the residuals as differences between actual and fitted values, enter the formulav=C2-H2 in cell I2 and copy it down to cell H17. Then calculate the standard error of estimate in cell F6 with the formula =SQRT(SUMSQ(I2:I17)/(16-1-1)).
/(16-1-1)).")
11
Solution -- continued The most important aspects of the output are the following: We estimate that each additional unit produced adds about $198 to total cost. The large R-square and multiple R values confirm exactly what the scatterplot indicates—that a very strong linear relationship exists between Total Cost and Units Produced. The standard error of estimate indicates that the prediction errors based on this regression equation will be in the neighborhood of $7000—many prediction errors will be less than this value and a few will be more. This large an error might sound like a lot, but it is not all that large compared to the magnitudes of total costs, which are often well over $100,000.

Similar presentations


 variable - measures the outcome of a study. Explanatory (Independent) variable - explains.>")


