Download presentation
Presentation is loading. Please wait.

1
RE/MAX Whatcom County, Inc. Real Estate Market Update For 4 th Quarter 2012

2
King CountySnohomish County Skagit CountyWhatcom County Green = Current Inventory Red = Pending Sales Blue = Closed Sales

3
King CountySnohomish SkagitWhatcom Months of Inventory

4
Island County

5
Whatcom County 3rd qtr 2012 633 pending 586 closed 3rd qtr 2011 503 pending 559 closed 4th qtr 2011 391 pending 445 closed 4th qtr 2012 498 pending 546 closed

6
Whatcom County Months of Inventory

7
Average and Median Price Comparison Quarterly Moving Average

8
Bellingham AverageMedianTotalRemainingMonths ofAverageTotal Dollar Sales PricePriceSoldInventory Days on MktVolume 4th Quarter 2012 $ 312,403 $ 276,7332763203.586 $ 86,647,116 4th Quarter 2011 $ 301,523 $ 247,4082034126.1107 $ 62,285,076 Change3.6%11.9%36.0%-22.3%-42.6%-19.6%39.1% Single FamilyCondos Sold Price 4th Qtr 2012 4th Qtr 2011Sold Price 4th Qtr 2012 4th Qtr 2011 $0$99,99943$0$99,99922 $100,000to$149,9991117$100,000to$149,999511 $150,000to$199,9993320$150,000to$199,999119 $200,000to$249,9994850$200,000to$249,99935 $250,000to$299,9994632$250,000to$299,99963 $300,000to$349,9992317$300,000to$349,9995 $350,000to$399,999227$350,000to$399,9991 $400,000to$449,999137$400,000to$449,999 $450,000to$499,99969$450,000to$499,99911 $500,000to$549,99914$500,000to$549,999 $550,000to$599,99972$550,000to$599,999 $600,000to$649,99941$600,000to$649,999 $650,000to$699,99921$650,000to$699,999 $700,000to$749,99921$700,000to$749,999 $750,000to$799,9993$750,000to$799,999 $800,000to$849,9991$800,000to$849,999 $850,000to$899,9991$850,000to$899,999 $900,000to$949,999$900,000to$949,999 $950,000to$999,999$950,000to$999,9991 $1,000,000to$1,250,0001 $1,000,000to$1,250,000 Total227172Total3432

9
Bellingham

11
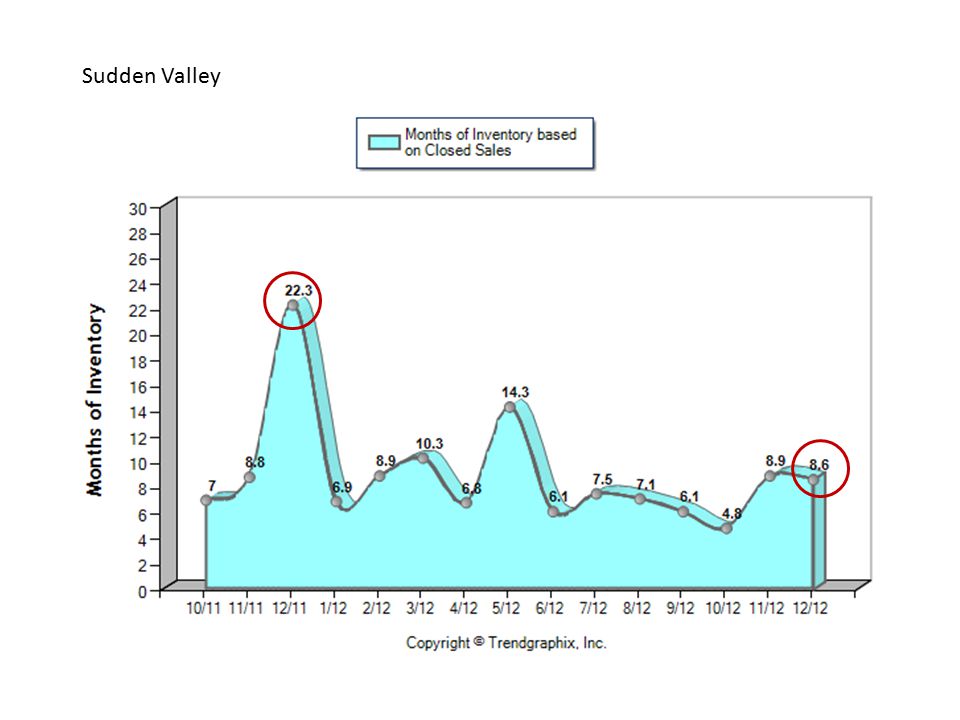
Sudden Valley AverageMedianTotalRemainingMonths ofAverageTotal Dollar Sales PricePriceSoldInventory Days on MktVolume 4th Quarter 2012 $ 213,254 $ 205,18427617.1116 $ 5,743,699 4th Quarter 2011 $ 233,853 $ 197,167247210.3103 $ 5,791,600 Change-8.8%4.1%12.5%-15.3%-31.1%12.6%-0.8% Single FamilyCondos Sold Price 4th Qtr 2012 4th Qtr 2011Sold Price 4th Qtr 2012 4th Qtr 2011 $0$99,9991$0$99,99911 $100,000to$149,99976$100,000to$149,99911 $150,000to$199,99956$150,000to$199,999 $200,000to$249,99984$200,000to$249,999 $250,000to$299,99932$250,000to$299,999 $300,000to$349,99932$300,000to$349,999 $350,000to$399,9991$350,000to$399,999 $400,000to$449,999$400,000to$449,999 $450,000to$499,999$450,000to$499,999 $500,000to$549,9992$500,000to$549,999 $550,000to$599,999$550,000to$599,999 $600,000to$649,999$600,000to$649,999 $650,000to$699,999$650,000to$699,999 $700,000to$749,999 1$700,000to$749,999 Total2724Total22

12
Sudden Valley

14
Ferndale AverageMedianTotalRemainingMonths ofAverageTotal Dollar Sales PricePriceSoldInventory Days on MktVolume 4th Quarter 2012 $ 293,005 $ 261,983761546.3123 $ 22,041,504 4th Quarter 2011 $ 262,487 $ 234,500741948.3132 $ 19,302,986 Change11.6%11.7%2.7%-20.6%-24.1%-6.8%14.2% Single FamilyCondos Sold Price 4th Qtr 2012 4th Qtr 2011Sold Price 4th Qtr 2012 4th Qtr 2011 $0$99,99924$0$99,999 $100,000to$149,99979$100,000to$149,999 $150,000to$199,999710$150,000to$199,999 $200,000to$249,9992016$200,000to$249,999 $250,000to$299,999126$250,000to$299,999 $300,000to$349,999811$300,000to$349,999 $350,000to$399,99995$350,000to$399,999 $400,000to$449,99955$400,000to$449,999 $450,000to$499,99912$450,000to$499,999 $500,000to$549,99941$500,000to$549,999 $550,000to$599,999$550,000to$599,999 $600,000to$649,9991$600,000to$649,999 $650,000to$699,9991$650,000to$699,999 $700,000to$749,9991 $700,000to$749,999 Total7770

15
Ferndale

17
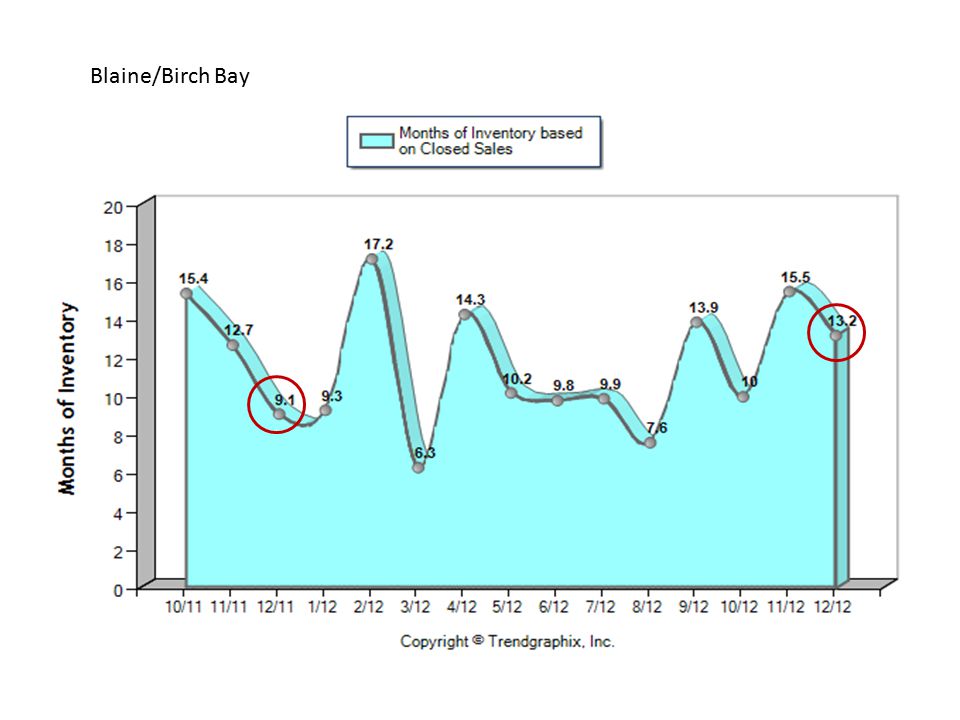
Blaine AverageMedianTotalRemainingMonths ofAverageTotal Dollar Sales PricePriceSoldInventory Days on MktVolume 4th Quarter 2012 $ 334,729 $ 274,1674417212141 $ 14,851,207 4th Quarter 2011 $ 230,604 $ 208,4425518710.5107 $ 12,753,260 Change45.2%31.5%-20.0%-8.0%14.3%31.8%16.5% Single FamilyCondos Sold Price 4th Qtr 2012 4th Qtr 2011Sold Price 4th Qtr 2012 4th Qtr 2011 $0$99,99913$0$99,99964 $100,000to$149,999311$100,000to$149,9992 $150,000to$199,99959$150,000to$199,99932 $200,000to$249,999119$200,000to$249,9995 $250,000to$299,99957$250,000to$299,9991 $300,000to$349,99926$300,000to$349,99913 $350,000to$399,99943$350,000to$399,9992 $400,000to$449,9991$400,000to$449,999 $450,000to$499,99921$450,000to$499,9991 $500,000to$549,99921$500,000to$549,999 $550,000to$599,9994$550,000to$599,999 $600,000to$649,9992$600,000to$649,9991 $650,000to$699,99911$650,000to$699,999 $700,000to$749,9991$700,000to$749,999 $750,000to$799,999$750,000to$799,999 Total44511912

18
Blaine/Birch Bay

20
Lynden AverageMedianTotalRemainingMonths ofAverageTotal Dollar Sales PricePriceSoldInventory Days on MktVolume 4th Quarter 2012 $ 260,789 $ 247,73251794.988 $ 13,285,886 4th Quarter 2011 $ 273,392 $ 252,300341331280 $ 9,280,359 Change-4.6%-1.8%50.0%-40.6%-59.2%10.0%43.2% Single FamilyCondo Sold Price 4th Qtr 2012 4th Qtr 2011Sold Price 4th Qtr 2012 4th Qtr 2011 $0$99,99911$0$99,99921 $100,000to$149,99944$100,000to$149,99935 $150,000to$199,99972$150,000to$199,99952 $200,000to$249,9991410$200,000to$249,99922 $250,000to$299,999118$250,000to$299,999 $300,000to$349,99962$300,000to$349,999 $350,000to$399,9992$350,000to$399,999 $400,000to$449,99912$400,000to$449,999 $450,000to$499,99911$450,000to$499,999 $500,000to$549,99922$500,000to$549,999 $550,000to$599,9991$550,000to$599,999 Total50321210

21
Lynden

23
Average and Median Price Comparison Quarterly Moving Average

24
From Top to Bottom to Now 4th Qtr. 2013 3 rd Qtr. 2007 Chg from Top 1st Qtr. 2012 Chg from Bottom Bellingham $ 312,403 $ 368,983-15% $ 296,0866% Sudden Valley $ 213,254 $ 294,550-28% $ 228,216-7% Ferndale $ 293,005 $ 334,465-12% $ 241,33321% Blaine/Birch Bay $ 334,729 $ 324,7353% $ 240,70239% Lynden $ 260,789 $ 332,647-22% $ 259,5600% Nooksack $ 220,972 $ 296,282-25% $ 211,5254% Mt. Baker $ 184,632 $ 167,94410% $ 97,32890% Now Top Bottom

25
Commercial/Industrial Whatcom County Current listings 161 Days on Market433 Average List Price$712,142 Median Price $350,000 Current # of Pending Sales4 Sold in 4 th Qtr 2012 23

26
RE/MAX Whatcom County, Inc. Real Estate Market Update For 4th Quarter 2012

Similar presentations


 forbid the unauthorized reproduction of this report by any means, including.>")


>")


