Download presentation
Presentation is loading. Please wait.

1
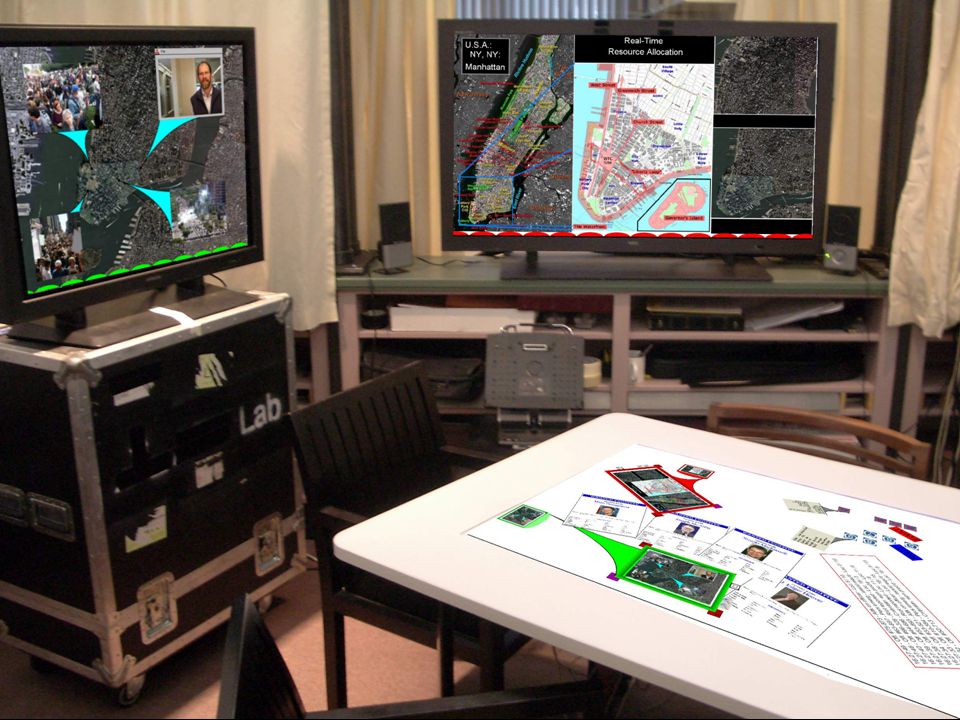
Cambridge, Massachusetts Perception of Elementary Graphical Elements in Tabletop and Multi-Surface Environments Daniel Wigdor, Chia Shen, Clifton Forlines, Ravin Balakrishnan CHI 2007 Department of Computer Science, University of Toronto

2
Acknowledgements John Barnwell John Hancock MERL & DGP Lab members Experiment participants

5
In-Plane Rotation

6
NOT THIS PAPER

7
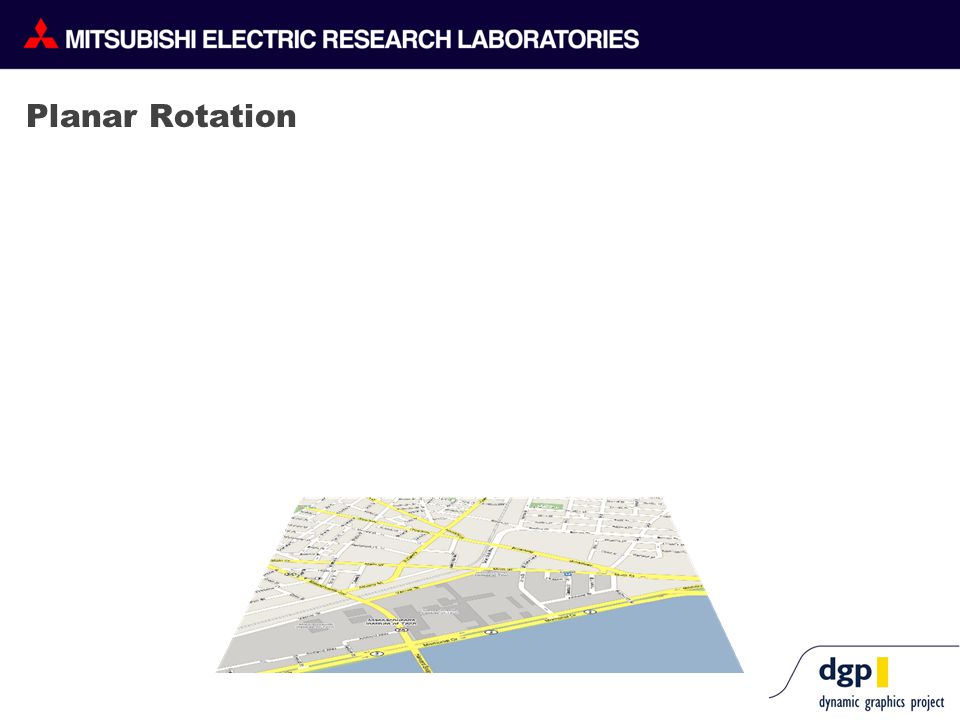
Planar Rotation

15
Information Graphics

17
Encoding & Decoding 1528 2352

18
Encoding & Decoding 1528 2352 Encode

19
Encoding & Decoding 1528 2352 Encode Decode

20
*

21
Cleveland and McGill: Elementary Perceptual Tasks Bertin: Visual Variables

22
Visual Variables

23
Colour

24
Visual Variables Colour

25
Visual Variables Colour

26
Visual Variables Colour

27
Visual Variables Colour Position

28
Visual Variables Colour Position

29
Visual Variables Colour Position Slope

30
Visual Variables Colour Position Slope

31
Visual Variables Colour Position Slope

32
Visual Variables Colour Position Slope

33
Visual Variables Colour Position Slope

34
Visual Variables Colour Position Slope Length

35
Visual Variables Colour Position Slope Length

36
Visual Variables Colour Position Slope Length

37
Visual Variables Colour Position Slope Length Area

38
Visual Variables Colour Position Slope Length Area

39
Visual Variables Colour Position Slope Length Area Angle

40
Visual Variables Colour Position Slope Length Area Angle

41
Visual Variables Colour Position Slope Length Area Angle

42
Visual Variables Colour Position Slope Length Area Angle

43
Visual Variables Colour Position Slope Length Area Angle Modulus:

44
Visual Variables Colour Position Slope Length Area Angle Modulus: Stimulus:

45
Visual Variables Colour Position Slope Length Area Angle Modulus: Stimulus: Answer: 38%

46
Visual Variables Colour Position Slope Length Area Angle Modulus: Stimulus: Answer: 38%

47
Visual Variables Colour Position Slope Length Area Angle

48
Visual Variables Colour Position Slope Length Area Angle Modulus:

49
Stimulus: Visual Variables Colour Position Slope Length Area Angle

50
Modulus: Stimulus: Answer: 40% Visual Variables Colour Position Slope Length Area Angle

51
Modulus: Stimulus: Answer: 40% Visual Variables Colour Position Slope Length Area Angle

52
Visual Variables Colour Position Slope Length Area Angle

53
Modulus: Visual Variables Colour Position Slope Length Area Angle

54
Modulus: Stimulus: Visual Variables Colour Position Slope Length Area Angle

55
Modulus: Stimulus: Answer: 67% Visual Variables Colour Position Slope Length Area Angle

56
Modulus: Stimulus: Answer: 67% Visual Variables Colour Position Slope Length Area Angle

57
57 Poor Elementary Perception

58
58 Slope vs Position

59
59 Slope vs Position

60
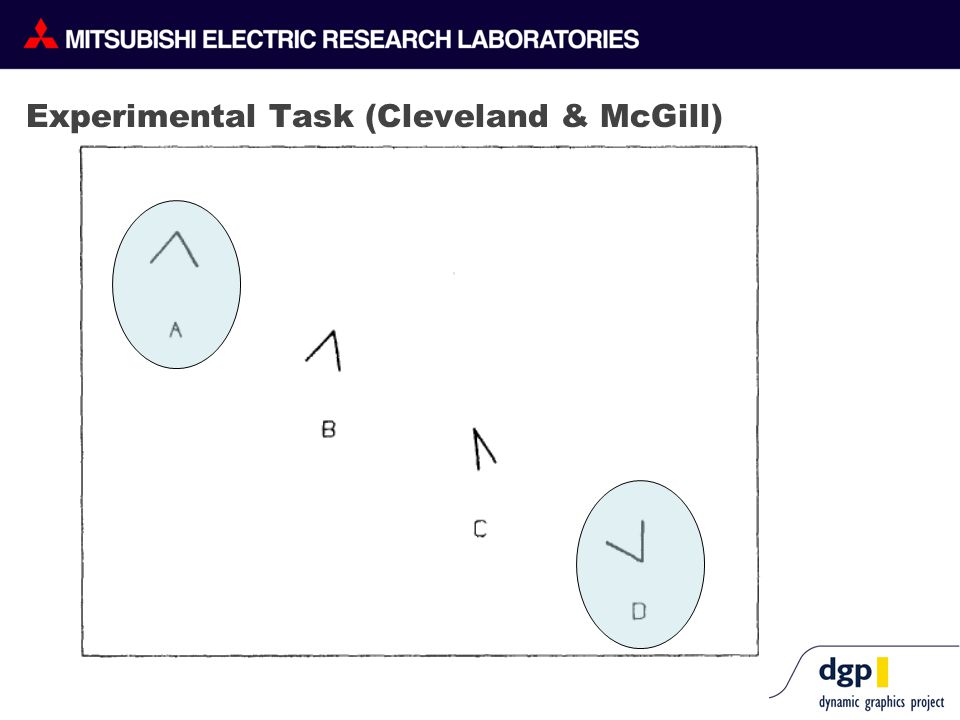
Experimental Task (Cleveland & McGill)
")
64
Conclusions (Cleveland & McGill) Error correlated with distance Rank order of elementary tasks: 1.Position, common scale 2.Position, identical nonaligned scales 3.Length 4.Angle 5.Slope 6.Area 7.Volume, Density, Colour saturation 8.Colour hue
 Error correlated with distance Rank order of elementary tasks: 1.Position, common scale 2.Position, identical nonaligned scales 3.Length 4.Angle 5.Slope 6.Area 7.Volume, Density, Colour saturation 8.Colour hue")
65
Graphical Perception on a Rotated Plane Vs.

66
Our Visual Variables:

67
Experimental Task Example: Line Length

68
Experiment 1: Single-Screen Comparisons 90° (Vertical) 60° 30° 0° (Tabletop)
 60° 30° 0° (Tabletop)")
72
Hypotheses I. As the display is tilted, the accuracy of relative magnitude judgements decreases.

73
Hypotheses I. As the display is tilted, the accuracy of relative magnitude judgements decreases. Error Display Angle Vertical Tabletop

74
Hypotheses II. The up/down distance between objects is positively correlated with the increase in error in magnitude judgements due to screen angle. Up/Down Distance ERROR

75
Hypotheses II. The up/down distance between objects is positively correlated with the increase in error in magnitude judgements due to screen angle. Tabletop Vertical

76
Hypotheses III. Different visual variable types have differing increases in the error in judgements.

77
Hypotheses III. Different visual variable types have differing increases in the error in judgements.

78
Hypotheses IV. Sideways presentations of objects experience less error in magnitude judgements due to screen angle than upright presentations.

79
Hypotheses IV. Sideways presentations of objects experience less error in magnitude judgements due to screen angle than upright presentations. Error

80
Hypotheses V. There will be no effect for side-to-side distance on the accuracy of magnitude perception. Side-to-side Distance

81
Hypotheses V. There will be no effect for side-to-side distance on the accuracy of magnitude perception. Side-to-side Distance

82
slope area position length angle Rank Ordering of Visual Variable Perceptibility Vertical Ranking: Tabletop Ranking:

83
position (upright) length (upright) angle (upright) slope area position (sideways) length (sideways) angle (sideways) position (upright) length (upright) angle (upright) slope area position (sideways) length (sideways) angle (sideways) length (upright) angle (upright) slope area position (sideways) length (sideways) angle (sideways) position (upright) Rank Ordering of Visual Variable Perceptibility Vertical Ranking: Tabletop Ranking:
 length (upright) angle (upright) slope area position (sideways) length (sideways) angle (sideways) position (upright) length (upright) angle (upright) slope area position (sideways) length (sideways) angle (sideways) length (upright) angle (upright) slope area position (sideways) length (sideways) angle (sideways) position (upright) Rank Ordering of Visual Variable Perceptibility Vertical Ranking: Tabletop Ranking:")
84
Multi-Surface Environments

85
Experiment 2: Apparatus

86
Hypotheses I.There is an increase in error when comparing visual variable magnitudes between upright and tabletop displays versus comparing on displays of a single orientation.

87
Hypotheses I.There is an increase in error when comparing visual variable magnitudes between upright and tabletop displays versus comparing on displays of a single orientation.

88
Hypotheses II.The error increase when comparing between displays is unevenly distributed across visual variable types.

89
Hypotheses II.The error increase when comparing between displays is unevenly distributed across visual variable types.

90
Hypotheses III.The size of the error on the mixed-orientation condition is larger than the largest errors in the previous experiment.

91
Hypotheses III. The size of the error on the mixed-orientation condition is larger than the largest errors in the previous experiment.

92
Recommendations Mixed-orientation screen comparisons are hard Ordered list (different than before): 1.length (sideways) 2.length (upright) 3.position (sideways) 4.angle (sideways) 5.area 6.angle (upright) 7.position (upright) 8.slope
: 1.length (sideways) 2.length (upright) 3.position (sideways) 4.angle (sideways) 5.area 6.angle (upright) 7.position (upright) 8.slope")
93
Conclusions Don’t compare across display orientations Special visualisations for tabletops & multi-surface spaces

94
Future Work Σ = ?

95
Questions?

96
Experiment 1 Design 12 participants x 4 display angles x 4 visual variables (per participant) x 3 modulus positions x 9 stimulus positions x 3 magnitude estimates = 15,552 total comparisons
 x 3 modulus positions x 9 stimulus positions x 3 magnitude estimates = 15,552 total comparisons")
97
Experiment 2 Design 8 participants x 2 display angles x 8 visual variables x 31 magnitude estimates = 3,968 total comparisons

Similar presentations


 Motion Controller Design for A Class of Second-order Systems Center for Self-Organizing Intelligent.>")


 interval 750 ms test 100 ms cue 250 ms Relevant size 28 (Palmer, after Shaw)>")
