Download presentation
Presentation is loading. Please wait.

1
Social Indicators for Nonpoint Source Projects Building Capacity for Sustainable Watershed Management in Illinois Presenter: Linda Prokopy, Purdue University Content based on materials developed in conjunction with Ken Genskow and Rebecca Power

2
Social Indicators for NPS Project Overview Develop a system for collecting and using social data to evaluate NPS management efforts in Great Lakes Region/Region 5 Partnership with USEPA, state water quality agencies, and land grant universities Provide assistance & support to state programs and NPS projects Complement existing “administrative” and “environmental” indicators

3
Three Types of Indicators Environmental –Pesticide levels, pH, E. coli Administrative –Bean counting! –Number of plans written, number of newsletters distributed number of newsletters distributedSocial

4
Management Response Driving Forces Human Behavior Effects of Change Management Strategies Options:RegulatePersuade –Outreach and education –Financial Support –Technical Support HD.gov

5
Conceptual Model Improvement & protection of water quality Improvement & protection of water quality social norms Program activities Program activities knowledge awareness skills attitudes capacity values Use of water quality management practices Use of water quality management practices constraints Driving Forces Human Behavior Effects Management Strategies

6
Overview of Social Indicators System Core indicators, supplemental indicators, and background/contextual factors All indicators measure change Scale is project level Currently focusing only on 319 projects Critical areas Target audiences

7
Targeting Focus efforts on area of greatest impact –Specific audience –Specific geographic area Some behaviors in some places can have a disproportionate impact on water quality

8
Targeting Critical Areas La Moine River Watershed, IL Source: McDermaid, K. 2005. Social Profile: La Moine River Ecosystem Partnership. University of Illinois at Urbana Champaign

9
Conceptual model Improvement & protection of water quality Improvement & protection of water quality social norms Program Activities Program Activities knowledge awareness skills attitudes capacity values Use of water quality management Practices Use of water quality management Practices constraints

10
Conceptual model Improvement & protection of water quality Improvement & protection of water quality social norms Program Activities Program Activities knowledge awareness skills attitudes capacity values Use of water quality management Practices Use of water quality management Practices constraints

11
Awareness Awareness of consequences of pollutants to water quality Awareness of pollutant types impairing water quality Awareness of pollutant sources impairing water quality Awareness of appropriate practices to improve water quality

12
Awareness of Consequences of Pollutants to Water Quality

13
Awareness of Pollutant Types Impairing Water Quality

14
Awareness of Pollutant Sources Impairing Water Quality

15
Awareness of Appropriate Practices to Improve Water Quality

16
Attitudes General water-quality-related attitudes Willingness to take action to improve water quality

17
General Water-Quality Related Attitudes

18
Willingness to Take Action to Improve Water Quality

19
Constraints Constraints to behavior change

20
Constraints to Behavior Change Constructs: –Economics / profitability –Financial incentives –Independence / own ideas –Environmental considerations –Status quo / traditional –Assistance incentives –Caution about government programs –Peer / norms considerations

21
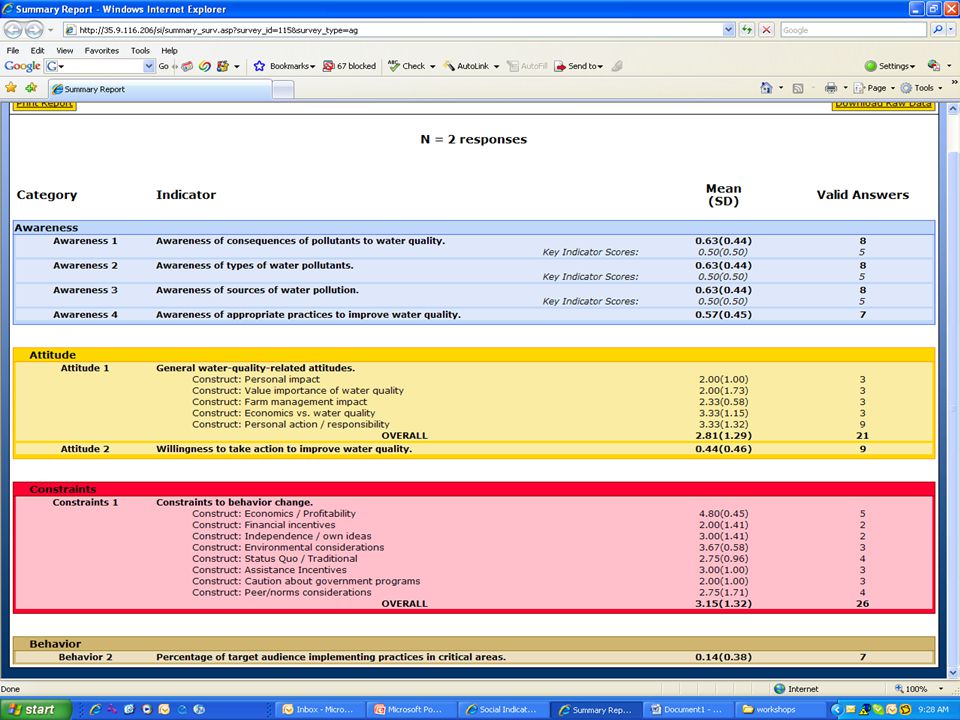
Constraints to Behavior Change

22
Capacity Grant recipient Resources leveraged by grant recipient For target audience Funding available to support NPS practices in critical areas Technical support available for NPS practices in critical areas Ability to monitor practices in critical areas

23
Behavior Percentage of critical area receiving treatment Percentage of target audience implementing practices in critical areas Ordinances in place that will reduce NPS stressors

24
Percentage of Target Audience Implementing Practices in Critical Areas

25
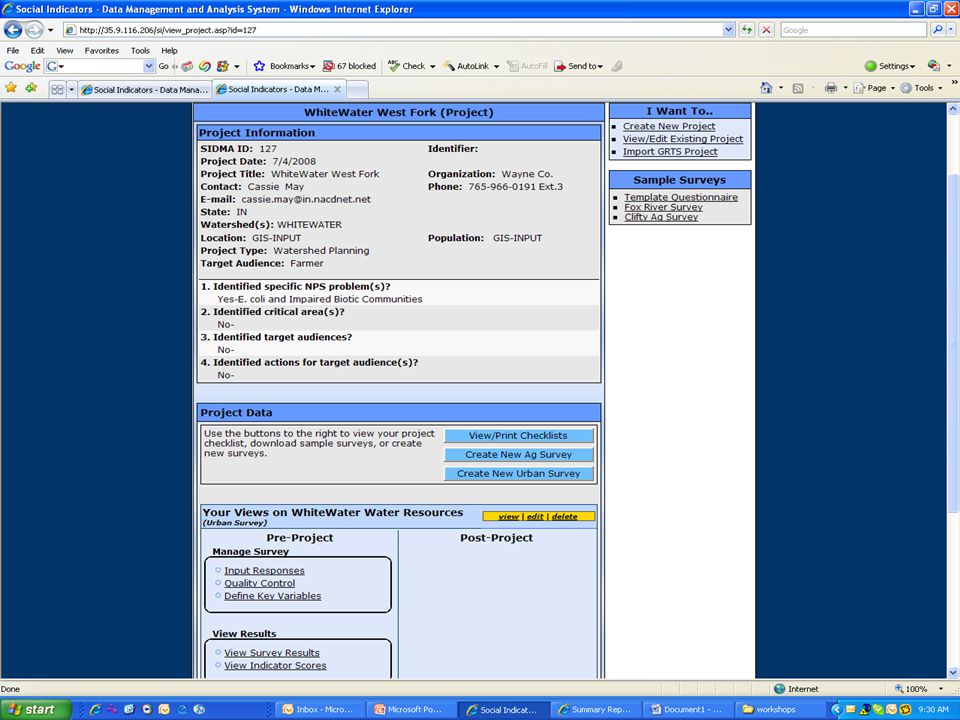
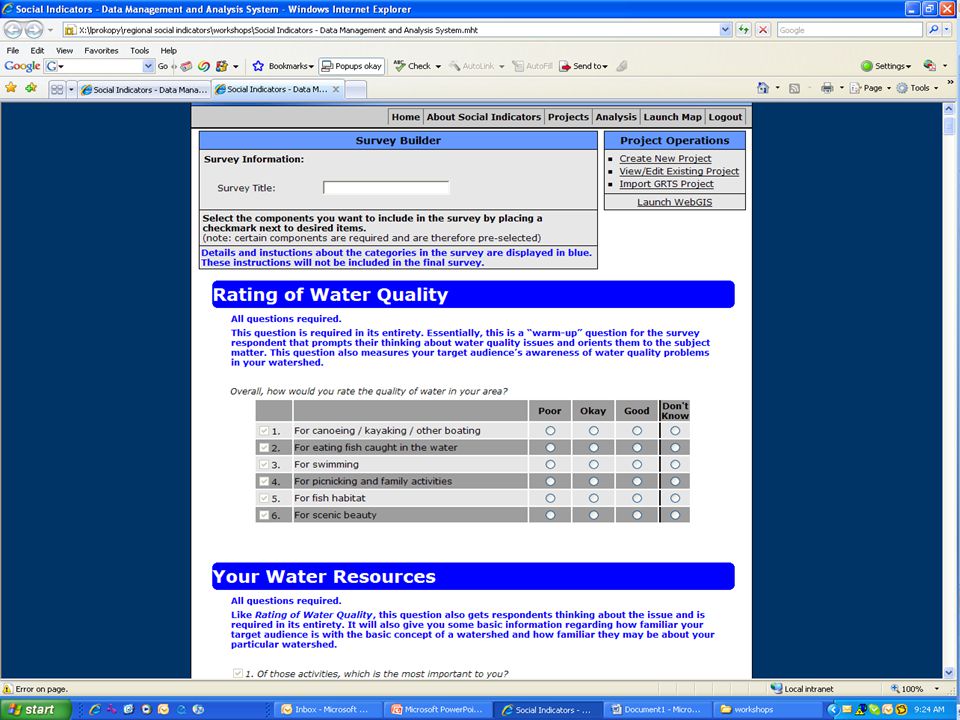
SI Planning and Evaluation Process

32
State and Regional Level Data can be summarized into impact reports Data can be compared across projects to see what worked and why

33
Using Social Indicators Clearly define environmental problems and the decision-makers ultimately responsible for solving them Clearly define linkages between environmental and social outcomes Identify Pollutants/ Stressors Select Practices Reach People Identify Places/ Causes

34
Using Social Indicators Identify social outcomes that will achieve project and watershed goals awareness attitudes capacity constraints behaviors Identify Pollutants/ Stressors Select Practices Reach People Identify Places/ Causes Improvement & protection of water quality Improvement & protection of water quality

35
Using Social Indicators Monitor impacts of outreach activities Feed evaluation data back into decision- making processes Adaptive Management Plan Act Monitor Evaluate

36
Social Indicators Team Team Co-Leaders: Ken Genskow, UW-Madison/UW-Extension Linda Prokopy, Purdue University Current Team Members: Jeremiah Asher, Michigan State University Adam Baumgart-Getz, Purdue University Joe Bonnell, The Ohio State University Cyd Curtis, EPA Region V Karlyn Eckman, University of Minnesota Kristin Floress, University of Wisconsin, Stevens Point Rebecca Power, CSREES Regional Water Quality Liaison Rachel Walker, University of Minnesota Danielle Wood, University of Wisconsin

37
Acknowledgements USEPA Region 5 Illinois Environmental Protection Agency Indiana Department of Environmental Management Michigan Department of Environmental Quality Minnesota Pollution Control Agency Ohio Environmental Protection Agency Wisconsin Department of Natural Resources Great Lakes Regional Water Program Land Grant Universities in USEPA Region 5

Similar presentations