Download presentation
Presentation is loading. Please wait.

1
Sensing the landscape: Collaborative Emotion Mapping in Urban Spaces
Eduarda Ferreira XIII COLOQUIO IBÉRICO DE GEOGRAFÍA

2
Sensing the landscape The objective is to map emotions of lesbian and bisexual women on public spaces. To identify significant dimensions of space and places that relate to lesbian and bisexual women social identities through collaborative maps based on bio data, on-site emotions, personal experiences and significances.

3
Emotional mapping workshop
Workshops To explore how the reactions of people on the streets to same-sex public displays of affection affect lesbian and bisexual women. Bio mapping workshop To collect eyes-on-the-street impressions of public spaces, using a printed map where each participant registers whatever catches her attention. Emotional mapping workshop The field work period was from March to June 2011

4
Bio mapping Workshop In pairs and holding hands or embracing, women (lesbians or bisexuals) drifted around spaces near their residence. Workshop One pair at a time; one of the women carried a heart rate sensor connected to a mobile phone equipped with GPS.; During the walk the mobile phone ran software that registered GPS tracking, heart rate data, and audio records of verbal comments; A semi-structured interview was conducted immediately after the walk focusing on the GPS track displayed on Google Earth and heart rate data; The participants interpreted the data displayed on Google Earth, adding personal significances and experiences.

5
Bio mapping Workshop 5 pairs participated (1 pair in Porto and 4 pairs in Lisbon) All the pairs of women were couples (on a relationship) Most of the women identify themselves as lesbians; only one identifies herself as bisexual The women who participated in Lisbon’s workshops have some common characteristics: they are all under 30 years old, they usually have same-sex displays of affection on public spaces, at least one of the women of the pair is a volunteer on a youth LGBT association.

6
Bio mapping Workshop

7
Bio mapping Workshop

8
Bio mapping Workshop The method used can highlight the relations between bio data and spatial variables, such as: increased heart rate while crossing the streets; and correlations on altitude, pace and heart rate. No evidences of relation between heart rate data of participants and the reactions of people on the streets to same-sex public displays of affection. Only women who felt comfortable to have same-sex public displays of affection volunteered to participate in the workshops.

9
Bio mapping Workshop Semi-structured interviews after the walk
Considering that these women: have same-sex public displays of affection on a regular basis; disclose their sexual orientation in most of their life contexts; are active participants of an LGBT youth organisation; some of them go to schools to give lectures on LGBT rights; it is significant that sexual orientation is still a cause of distress and discomfort in some contexts of their lives, namely family and/or work, and that to have same-sex public displays of affection on some spaces is problematic and difficult.

10
Emotional mapping Workshop
Women (lesbians or bisexuals) meeting in an urban area identified as LGBT friendly (Bairro Alto, Lisbon). Group Workshop INSTRUCTTIONS Register whatever catches your attention Use all senses, not only your eyes. Register sounds, smells, skin sensations, etc. Drift around paying particular attention to everything that relates to heteronormative aspects of public space or discomfort on displaying same-sex displays of affection.
 meeting in an urban area identified as LGBT friendly (Bairro Alto, Lisbon). Group Workshop. INSTRUCTTIONS. Register whatever catches your attention. Use all senses, not only your eyes. Register sounds, smells, skin sensations, etc. Drift around paying particular attention to everything that relates to heteronormative aspects of public space or discomfort on displaying same-sex displays of affection.")
11
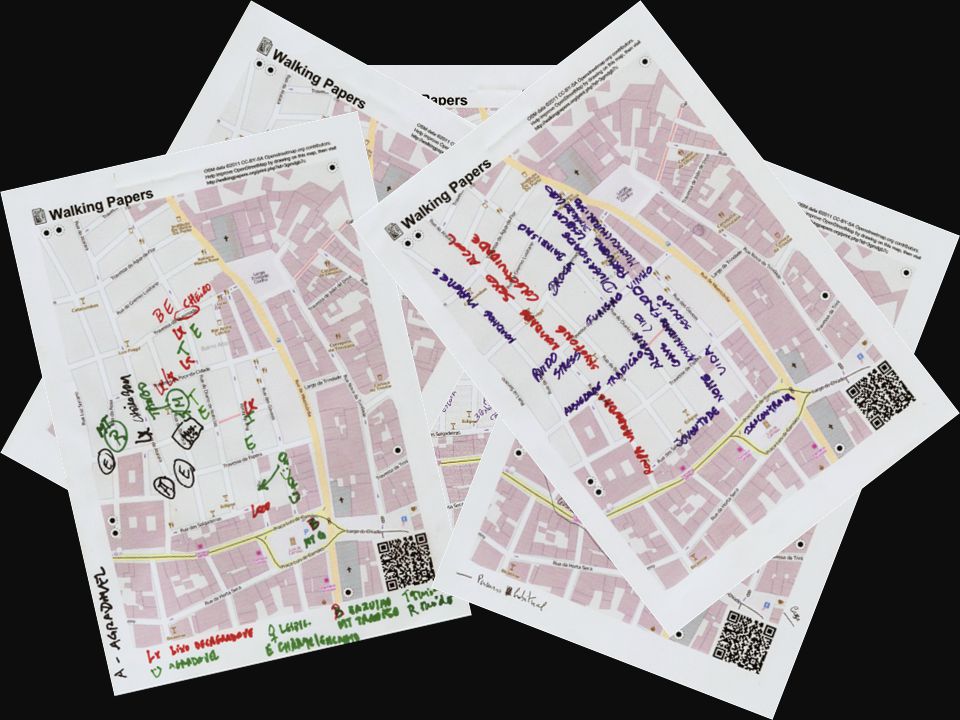
Emotional mapping Workshop
Map retrieved from Walking Papers with information from Open Street Map

12
Emotional mapping Workshop
Participants: 20 women Most of them: identify themselves as lesbians live on urban areas have at least a secondary level of education are more than 30 years old have a diversified professional occupation (3 of them were unemployed)
")
14
Analysis of the results
Transcript Coding Georeferencing Analysis

15
Analysis of the results
To transcript all the maps’ notations; To make a list of all the words used in the notations, using the software TextSTAT. Transcript

16
Analysis of the results
To code each notation according to the degree of pleasantness (Positive – Green; Negative – Black; Neutral – Blue; Danger - Red) To relate the degree of pleasantness to perception/senses (vision, smell, hearing, taste) and concepts (interpretations of perceptions, states of mind; abstractions); Coding
 To relate the degree of pleasantness to perception/senses (vision, smell, hearing, taste) and concepts (interpretations of perceptions, states of mind; abstractions); Coding.")
17
Analysis of the results
To create placemarks on Google Earth for each map’s notation, according to their position on the maps produced by the participants. The placemarks are coloured (Green, Black, Blue and Red) according to the coding process of the degree of pleasantness. Georeferencing
 according to the coding process of the degree of pleasantness. Georeferencing.")
18
Analysis of the results
To analyse the frequency and distribution of the degree of pleasantness, the use of perception/senses or concepts, and the interrelations between them; To analyse the words used on the notations: frequency and category. Analysis

19
Analysis of the results
On the 20 maps retrieved on the workshop, there were a total of 295 notations, with a minimum of 3 and a maximum of 32 per map, and an average of 15 notations per map. These numbers illustrate the diversity of the maps collected. Some had full sentences, others just scattered words, and very few had drawings (just some symbols like similes).
.")
20
Visualization on Google Earth of the degree of pleasantness of the area
Legend: Positive – Green; Negative – Black; Neutral – Blue; Danger - Red

21
Exploration on Google Earth of the notations’ content

22
Codification of notations according to the degree of pleasantness

23
The coding of Perception/Senses differentiated Vision, Smell, Hearing and Taste. No notations had any reference to Touch. The Concepts coding referred to notations not related to senses acquired information of the surrounding space and consisted of words, such as: freedom, lowliness, equality, diversity, etc.

24
Emotional mapping Workshop
Codification of notations according to the use of senses and concepts Instructions specifically instructed the use of all senses vision was clearly dominant The use of concepts consisted of a great diversity of words, such as: charm, enchantment, diversity, environment, meeting, tourism, confused, empty, friendly, news, pleasant, Portugal, quiet, tradition, etc.

25
Emotional mapping Workshop
Use of senses and concepts on the notations coded as positive or negative Concepts positive notations | Vision negative notations Concepts and ideas associated with this geographic area are more positive than the actual perception of this neighbourhood LGBT friendly area vs. Botellón phenomena

26
Emotional mapping Workshop
Positive Negative Neutral Good 19 Garbage/dirt 17 Gay/s 9 Lesbian/s 8 Dark 6 Bar/s 7 Smell Noise/s Music Cars/Traffic 5 Cool Men Woman/en Gaze 4 People Food / To eat Tourism/Tourists Diversity Wine/Beer Nice To like Words used on notations according to the degree of pleasantness of the notations ‘Garbage/Dirt’ negative = Botellón phenomena Words related to gender or sexual orientation: ‘Lesbian/s’ and ‘Woman/en’ positive ‘Gaze’ negative = ‘the eyes of others’ as one of the most pervasive causes of discomfort and intimidation in public spaces)
")
27
Sensing the landscape Bio Mapping workshops - there were indicators that support the use of this methodology to explore relations between bio data and spatial variables; Emotional mapping workshop - contributes to a better understanding of emotions related to a specific location/space (dissonance between the positive representation of the neighbourhood and the negative perception related to the Botellón phenomena) ‘Sensing the landscape’ results can contribute to create a different way of mapping, making visible the interactions of space and identities, including people’s perceptions and emotions on maps, and producing specific maps to specific groups of people.
 ‘Sensing the landscape’ results can contribute to create a different way of mapping, making visible the interactions of space and identities, including people’s perceptions and emotions on maps, and producing specific maps to specific groups of people.")
Similar presentations


 Music Syllabus Implementation Workshop. Objectives of Workshop Interpret the GCE N(T) Music syllabus Plan the N(T) Music course Teach the N(T) Music.>")


 69:211–221 DOI 10.1007/s10708-007-9111-y Presented by: Group.>")

