Download presentation
Presentation is loading. Please wait.

2
Comparing State Reading and Math Performance Standards Using NAEP Don McLaughlin Victor Bandeira de Mello National Conference on Large-Scale Assessment San Antonio June 2003

3
Another look at NAEP’s role in the context of NCLB Confirm state gains. Help state assessment programs to help each state’s schools and students. Answer questions for/about the state assessment. Provide a test bed for new solutions.

4
Complexities in confirming state gains Sampling Exclusions, Absences, Small samples Measurement Accommodations, Framework, Format, Time of year, Motivational context Differential sensitivity Analysis Gaps Design Grade-to-grade growth

5
NAEP’s strengths for helping state assessment programs NAEP is administered with uniform procedures to a representative sample of public school students in every state. This can illuminate cross-assessment comparisons. NAEP can carry out validity research to address questions relevant to all assessments (e.g., validity of accommodations).
..")
6
Questions NAEP can answer for state assessments 1. How do your state’s performance standards for math and reading compare with other states’? 2. How do your state’s assessment instruments compare to others in focus and difficulty? 3. Can your state assessment’s identification of schools that need improvement be enhanced?

7
Questions NAEP can answer for state assessments 4. Is your state’s assessment more (or less) sensitive to race or poverty differences in achievement than other states’? 5. Are differences between types of schools in your state similar to analogous differences in other states? 6. How do your identification and testing procedures for SD/ELL students differ from those in other states?
 sensitive to race or poverty differences in achievement than other states’. 5. Are differences between types of schools in your state similar to analogous differences in other states. 6. How do your identification and testing procedures for SD/ELL students differ from those in other states .")
8
Comparison of state performance standards, using NAEP Achievement levels are set separately in each state, using a variety of standard- setting methodologies. Does “meeting the standard” mean something different in each state? … How different? How do states’ targets for adequate yearly progress differ?

9
Comparison of state performance standards, using NAEP By comparing NAEP results with state assessment results in the same schools, we can approximate where on the NAEP scale the cutpoint for the state’s standard lies. This requires matching a database of state assessment results to the NAEP database.

10
National Longitudinal School-Level State Assessment Score Database Scores provided by State Education Agencies Processed by the American Institutes for Research Funded by the U.S. Department of Education Policy and Program Studies Service School-level scores in the public domain.

11
National Longitudinal School-Level State Assessment Score Database Scores for > 80,000 public schools in 49 states, Puerto Rico, and DC from 1997-1998 through 2001-2002 (but not all years in all states) merged with Common Core of Data
 merged with Common Core of Data")
12
National Longitudinal School-Level State Assessment Score Database Available at www.schooldata.org www.edtrust.org www.greatschools.net Contact: statedata@air.org

14
Method Match the “percent meeting the state’s standard” in each school to the distribution of NAEP plausible values in the school’s NAEP sample.

15
e. g., If 30 percent of the students in a school are reported by the state testing program to meet the state’s standard, Find the NAEP plausible value that has 30 percent of the distribution higher than it. (If the NAEP mean in the school is 220, that value might be 230.)
.")
16
o o o o o N o o o o o N o o o o o N o N o o o o o o N o o o o No o o o o N o N o o o o N o o o o o o N o o o o o o o N o o o o o N o o o N o o o o o o o o o o N o o o o N o o o o o N o o o o o o N o o o o o o N o o o N o o o o in a school selected to participate in NAEP o o o o o o o o o o o o o o o o o o o o o o o o N o o o o o N o o o o o N o N o o o o o o N o o o o N o o o o o N o N o o o o N o o o o o o N o o o o o o o N o o o o o N o o o N o o o o o o o o o o N o o o o N o o o o o N o o o o o o N o o o o o o N o o o N o o o o Grade 4 Students Some are selected for NAEP Some meet state standard

17
o N o o o N o o o N o o o o o N o o N o o o N o o o o o o o N o o o o o o o o N o o N o o o o o o o o o o o N o o o o o N o o o o o N o o o o o o N o o o o o o N o o o o o o N o o N o o o o o o o o N o o o o o o o o N o o N o ----------------------------------------- Achievement Scale o o o o o N o o o o o N o o o o o N o N o o o o o o N o o o o No o o o o N o N o o o o N o o o o o o N o o o o o o o N o o o o o N o o o N o o o o o o o o o o N o o o o N o o o o o N o o o o o o N o o o o o o N o o o N o o o o in a school selected to participate in NAEP o N o o o N o o o N o o o o o N o o N o o o N o o o o o o o N o o o o o o o o N o o N o o o o o o o o N o o o o o o o o N o o o o o N o o o o o o N o o o o o o N o o o o o o N o o N o o o o o o o o N o o o o o o o o N o o N o ------------------------------------------ Achievement Scale Achievement frequency distribution in the school

18
n n n n n n n n n n n n n n n n n n n n n n n n n n n n n n n n n n n n n n n n n n n n n n n n n n n n n n n n n n n n n n n n n n n n n n Achievement Scale (NAEP Reading) o N o o o N o o o N o o o o o N o o N o o o N o o o o o o o N o o o o o o o o N o o N o o o o o o o o o o o N o o o o o N o o o o o N o o o o o o N o o o o o o N o o o o o o N o o N o o o o o o o o N o o o o o o o o N o o N o Achievement Scale (State Reading Assessment) in a school selected to participate in NAEP 30 % of the distribution in one school might correspond to 230 on the NAEP scale, in that school.
 o N o o o N o o o N o o o o o N o o N o o o N o o o o o o o N o o o o o o o o N o o N o o o o o o o o o o o N o o o o o N o o o o o N o o o o o o N o o o o o o N o o o o o o N o o N o o o o o o o o N o o o o o o o o N o o N o Achievement Scale (State Reading Assessment) in a school selected to participate in NAEP 30 % of the distribution in one school might correspond to 230 on the NAEP scale, in that school.")
21
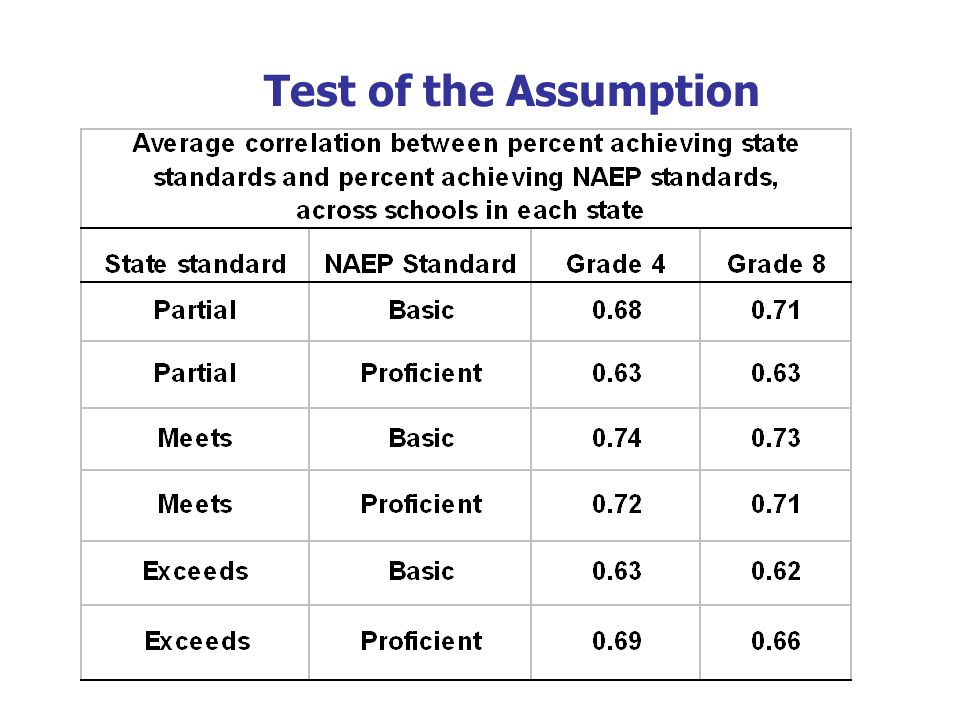
Assumption State reading assessment score variation is strongly related to NAEP score variation.

22
Assumption State reading assessment score variation is strongly related to NAEP score variation. If so, then we should get approximately the same estimate of the position of the state standard on the NAEP scale from nearly all NAEP schools in the state.

23
Test of the Assumption

36
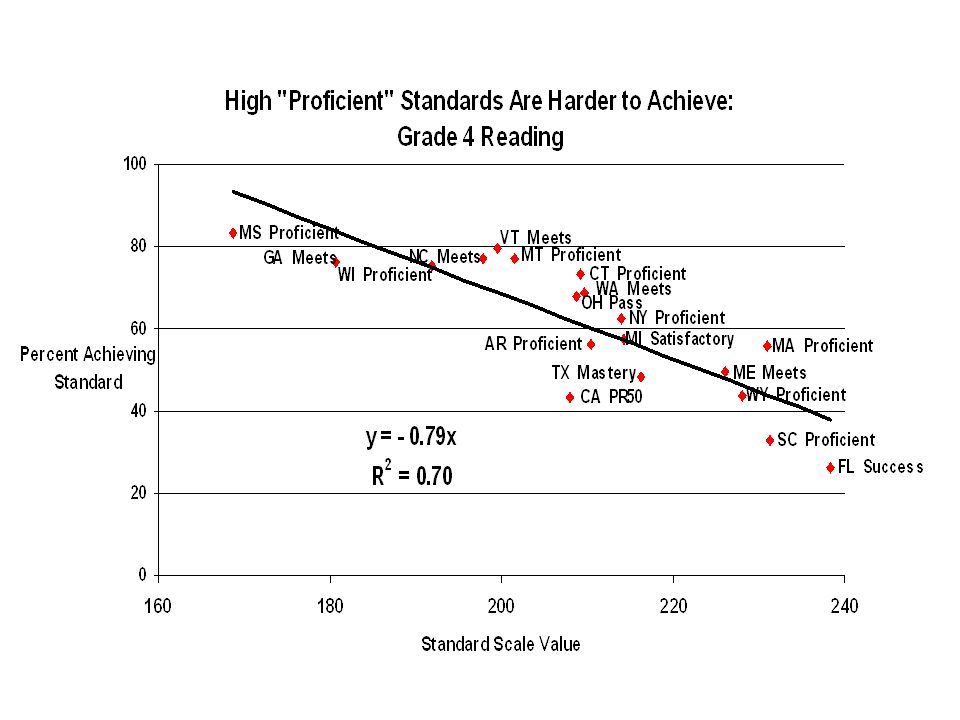
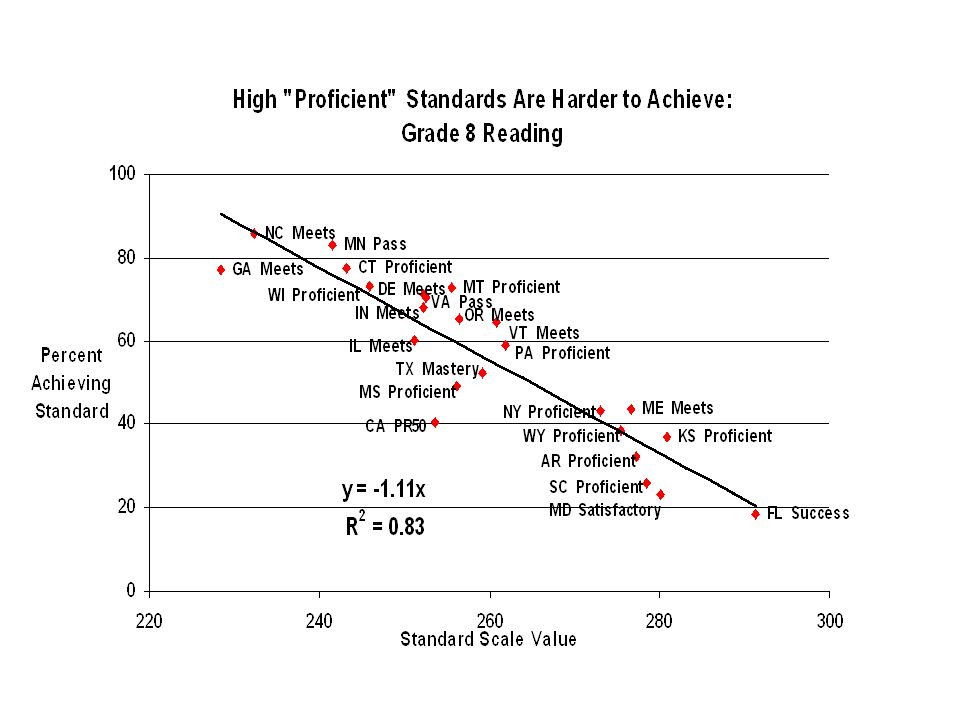
Conclusions NAEP can provide a link between state achievement standards, especially at the proficient and advanced levels. There is substantial variation in standards between states. Percentages of students meeting state standards are lower in states in which the standards are set high. Most of the links for “below proficient” standards are weak.

37
Summary NAEP can contribute most to Leaving No Child Behind by helping state assessment programs give useful feedback to parents, teachers, and school administrators.

Similar presentations


 High Growth, High Achieving Schools: Is It Possible? Fall, 2011 PVAAS Webinar.>")


