Download presentation
Presentation is loading. Please wait.

2
TLE: Teacher Leader Effectiveness Tulsa Model SAG: Student Academic Growth VAM: Value Added Model SLO/SOO: Student Learning Objective/Student Outcome Objective OAM: Other Academic Measures

3
100% of Evaluation Score based on Tulsa Model Rubric What We Create for OAMs and SLOs/SOOs this Year Counts Next Year (includes state test data for VAMs)
")
5
Must have at least 10 tested students to receive VAM score.

6
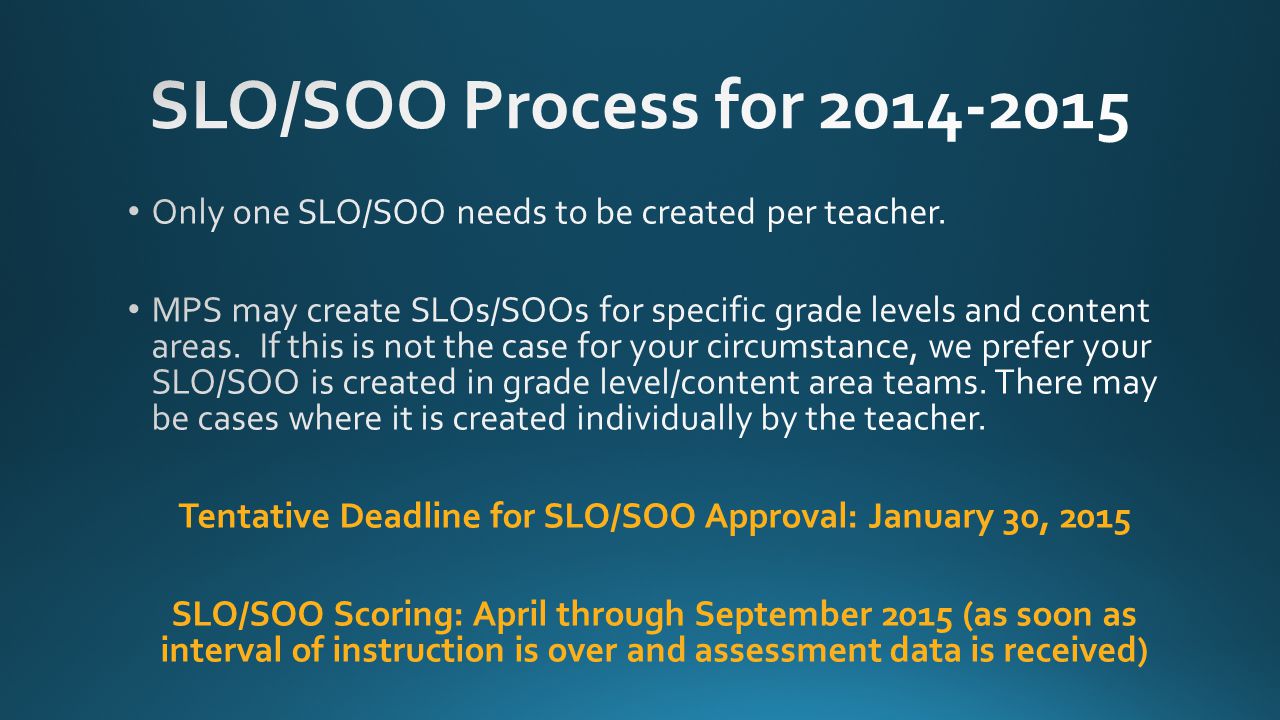
Those not receiving a VAM score must complete a SLO/SOO as 35% of their 2015-2016 TLE evaluation.

9
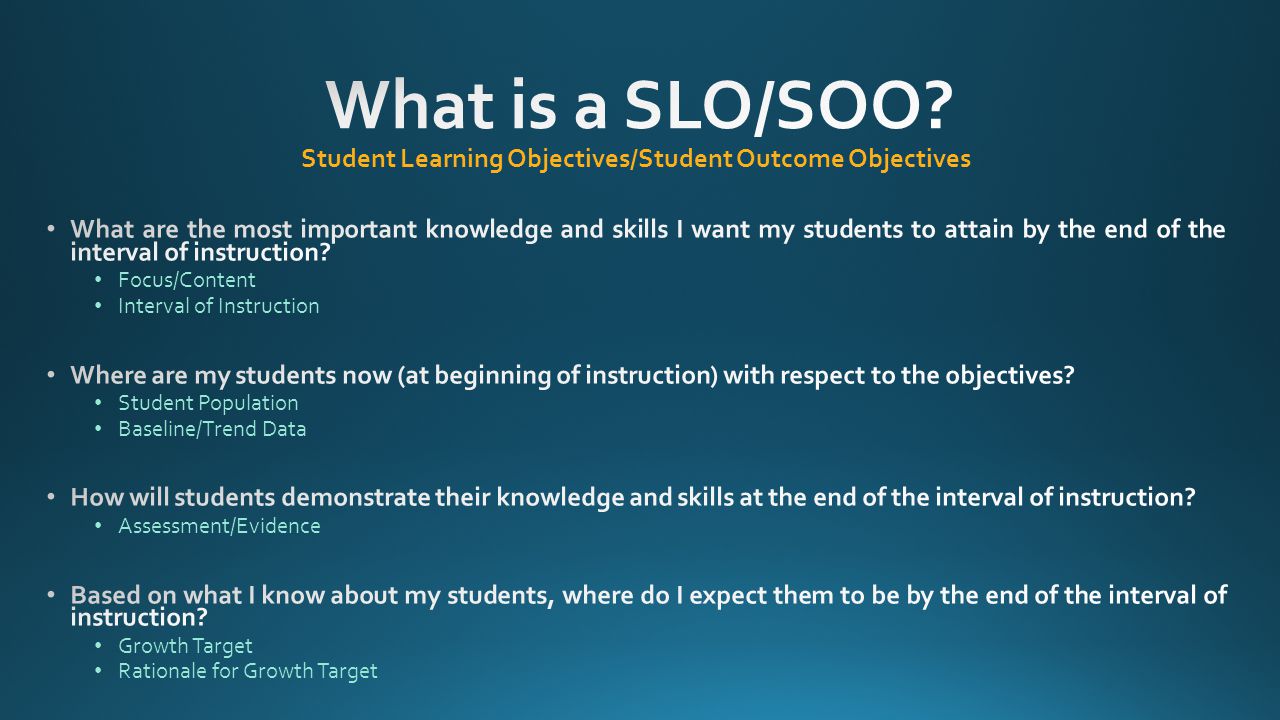
Step 1: Focus and Content Step 2: Interval of Instruction Write beginning and ending date of instruction. (If possible, we would prefer a year or semester interval of instruction. However, we understand that the limited time frame might only lend itself to a unit-long interval of instruction.)
.")
10
Step 3: Student Population

11
Step 4: Baseline/Trend Data

12
Step 5: Assessment/Evidence

13
Hierarchy of Assessments for SLOs/SOOs 1.State test or district assessment (purchased or created) 2.Common assessment (purchased or created - can include those provided in textbooks) 3.Individual classroom assessment (purchased) 4.Individual classroom assessment (created – must be approved by evaluating administrator) Curriculum coordinators are available to help as needed.
 2.Common assessment (purchased or created - can include those provided in textbooks) 3.Individual classroom assessment (purchased) 4.Individual classroom assessment (created – must be approved by evaluating administrator) Curriculum coordinators are available to help as needed.")
14
Step 6: Growth Targets Pre-assessment Score Distance to 100Growth Target (Pre-Assessment Score + Half Distance to 100%) 2377 (half is 38.5)62% (round up) 5050 (half is 25)75% 7624 (half is 12)88%
 2377 (half is 38.5)62% (round up) 5050 (half is 25)75% 7624 (half is 12)88%")
15
Step 6: Growth Targets

16
Step 7: Rationale for Growth Targets

17
SLO/SOO Score% of Students Who Met or Exceeded Growth Targets (round up in every situation) 5.090-100% 4.585-89% 4.080-84% 3.575-79% 3.070-74% 2.565-69% 2.060-64% 1.555-59% 1.054% or less
 % % % % % % % % 1.054% or less")
20
Resources http://www.gtlcenter.org/learning-hub/student-learning-objectives http://www.coloradoplc.org/assessment http://www.mooreschools.com/Page/36933

Similar presentations


>")


 and the Connecticut Academic Achievement Test (CAPT) Spring 2013 Presented to the Guilford Board of Education September.>")


>")


