Download presentation
Presentation is loading. Please wait.

1
One-Way and Factorial ANOVA SPSS Lab #3

2
One-Way ANOVA Two ways to run a one-way ANOVA 1.Analyze Compare Means One-Way ANOVA Use if you have multiple DV’s, but only one IV 2.Analyze General Linear Model Univariate Use if you have only one DV bc/ can provide effect size statistics More on this later (factorial ANOVA section)
")
3
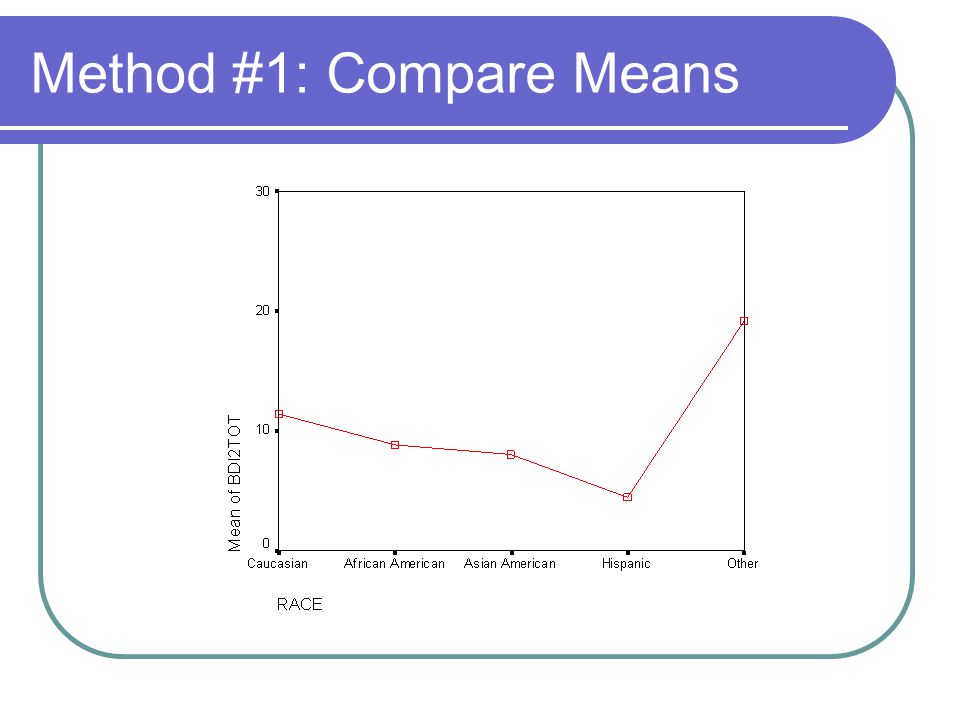
Method #1: Compare Means First we have to test if we meet the assumptions of ANOVA: Independence of Observations Cannot be tested statistically, is determined by research methodology only Normally Distributed Data Shapiro-Wilk’s W statistic, if significant, indicates significant non-normality in data Analyze Descriptive Statistics Explore Click on “Plots”, make sure “Normality Plots w/Tests” is checked

4
Testing Assumptions

5
Homogeneity of Variances (Homoscedasticity) Tested at the same time you test ANOVA Analyze Compare Means One-Way ANOVA Click on “Options” and make sure “Homogeneity of variance test” is checked If violated, use Brown-Forsythe or Welch statistics, which do not assume homoscedasticity
 Tested at the same time you test ANOVA Analyze Compare Means One-Way ANOVA Click on Options and make sure Homogeneity of variance test is checked If violated, use Brown-Forsythe or Welch statistics, which do not assume homoscedasticity")
6
Method #1: Compare Means One-Way ANOVA Analyze Compare Means One-Way ANOVA “Dependent List” = DV’s; “Factor” = IV Options Descriptive Fixed and random effects Homogeneity of variance test Levene’s Test: Significant result Non-homogenous variances Brown-Forsythe Welch Means plot

7
Method #1: Compare Means

9
One-Way ANOVA Post-Hoc Can only be done if your IV has 3+ levels Pointless if only 2 levels, just look @ the means Click the test you want, either with equal variances assumed or not assumed DON’T just click all of them and see which one gives what you want (that’s cheating), select the test you want priori
, select the test you want priori")
10
Method #1: Compare Means Contrasts Click “Polynomial”, Leave “Degree” at default (“Linear”) Enter in your coefficients # of coefficients should equal # of levels of your IV Doesn’t count missing cells, so if you have 3 levels, but no one in one of the levels, you should have 2 coefficients Coefficients need to sum to 0
 Enter in your coefficients # of coefficients should equal # of levels of your IV Doesn’t count missing cells, so if you have 3 levels, but no one in one of the levels, you should have 2 coefficients Coefficients need to sum to 0")
11
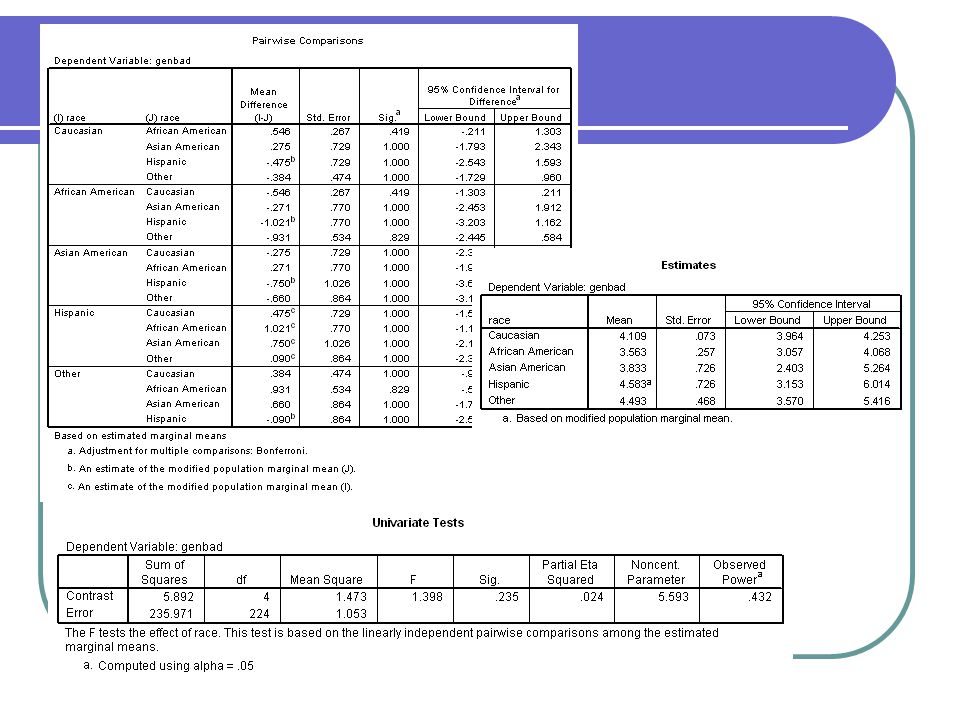
Method #1: Compare Means Contrasts Enter in your coefficients IV = Race – 1=Caucasian, 2=African American, 3=Asian American, 4=Hispanic, 5=Native American, 6=Other, BUT there were no Native Americans in the sample If you want to compare Caucasians to “Other”, coefficients = 1, 0, 0, 0, -1 Caucasians vs. everyone else = -1,.25,.25,.25,.25

12
Method #1: Compare Means

13
Method #2: Univariate Univariate works for both one-way (1 IV) and factorial ANOVA’s (2+ IV’s) Allows for specification of both fixed and random factors (IV’s) Assumptions Independence of Observations Normally Distributed Data Both same as one-way ANOVA
 and factorial ANOVA’s (2+ IV’s) Allows for specification of both fixed and random factors (IV’s) Assumptions Independence of Observations Normally Distributed Data Both same as one-way ANOVA")
14
Factorial ANOVA Assumptions: Homoscedasticity Tested at the same time you test ANOVA Click on Analyze General Linear Model Univariate Click on “Options” and make sure “Homogeneity tests” is checked

15
Factorial ANOVA Options Estimated Marginal Means Displays means, SD’s, & CI’s for each level of each IV selected If “Compare main effects” is checked, works as one-way ANOVA on each IV selected “Confidence interval adjustments” allows you to correct for inflation of alpha using Bonferroni or Sidak method Descriptive statistics Estimates of effect size Observed power Pointless, adds nothing to interpretation of p-value and e.s. Homogeneity tests Levene’s test

16
Factorial ANOVA

18
Save Don’t worry about this for now Post Hoc Select the IV for which you wish to compare all levels against all other levels (i.e. that you don’t plan to do planned comparisons on) Click on the right arrow button so the IV is in the box labeled “Post Hoc Tests for” Check the post hoc tests you want done, either with equal variances assumed or not assumed Click “Continue”
 Click on the right arrow button so the IV is in the box labeled Post Hoc Tests for Check the post hoc tests you want done, either with equal variances assumed or not assumed Click Continue .")
20
Factorial ANOVA Plots Horizontal Axis What IV is on the x-axis Separate Lines Separate Plots

21
Factorial ANOVA The following graph has the IV “Race” on the horizontal axis and separate lines by the IV “Gender”

22
Factorial ANOVA Model Allows you to: Denote which main effects and interactions you are interested in testing (default is to test ALL of them) Specify which type of sum of squares to use Usually you won’t be tinkering with this
 Specify which type of sum of squares to use Usually you won’t be tinkering with this")
23
Factorial ANOVA Contrasts Tests all levels within one IV Concern yourself with Simple only for now “Reference category” = What level all others are compared to (either first or last, with this referring to how they were numbered) Can test specific levels within one IV with specific levels in another IV, but requires knowledge of syntax
 Can test specific levels within one IV with specific levels in another IV, but requires knowledge of syntax")
25
Factorial ANOVA

26
Interpreting interactions See graphs

Similar presentations


-the General Linear Model (GLM)>")

 factorial with n = 5 replicate Total number of observations:>")

-the General Linear Model (GLM)>")


 by Julia Hartman Next.>")

