Download presentation
Presentation is loading. Please wait.

1
State of the School Presentation Thursday September 20, 2012 Russell D. Jones Superintendent

2
Who We Are Colegio Franklin Delano Roosevelt, the American School of Lima is an independent, international school providing a college preparatory program in English for students from age 3 through grade 12. Accredited by AdvanEd (SACS) Authorized by the IBO
 Authorized by the IBO.")
3
Who We Serve An international community composed of : 1508 Students 797 Peruvian 357 US Passport holders 45 Canadian 37 Korean 42 Nationalities

4
FDR Nationality Chart Percentage of students by nationality in the academic year 2011-2012.

5
Our Mission Statement “Our Mission is to empower our students to pursue their passion for learning, lead lives of integrity and create socially responsible solutions”

6
Our Vision Statement The school will provide an educational experience that: is academically rigorous enhances student learning through a diversity of teaching practices and styles encourages independent thought, collaboration and artistic expression offers choices in curricular and co-curricular activities promotes environmental responsibility and social awareness is competitive by international standards for a community that is united by the English language.

7
Our Core Values Colegio Roosevelt believes that: Embracing diversity sustains and enriches life. Service develops the individual and builds community. Experience is the most profound source of learning. Each person has the potential to contribute. Individual integrity is fundamental to a healthy community. Choice empowers. Survival of humanity depends on the health of the environment.

8
IB World School FDR offers all three curricular offerings of the International Baccalaureate, the Primary Years, Middle Years and Diploma Programs. This curriculum puts the student at the center of his or her learning and is characterized by an emphasis on thematic, inquiry-based and interdisciplinary learning. All students are expected to understand support and model the attributes of IB Learner Profile which are to be:

9
Inquirers Knowledgeable Thinkers Communicators Principled Open-Minded Caring Risk Takers Balanced Reflective

10
Instituto Board of Directors Colegio Roosevelt FDR Legal Structure

11
Instituto Associates U.S. Embassy – Michael Fitzpatrick Goodyear del Perú – John Ospina Newmont Peru - Luis Echevarría Southern Perú Copper - Marco Antonio García Thomas Findley Tony Hines Guillermo Palomino Jorge Muñiz

12
Instituto Board of Directors Dolores Goytisolo Board President Jorge BasadreSoledad Gadea Ignacio BustamanteMaria Yoshiyama James Cunningham Flavio Mirella Martin FariñaJaime Pinto Eric FlohrJaime Raygada

13
Colegio Roosevelt Charitable Trust Members Tony Arias Bruno Bonierbale Dolores de Goytisolo Tony Hines Eduardo Hochschild Russell Jones Deidre Simon

14
Russell D. Jones Superintendent Chris Akin Secondary School Principal Rachel Metcalf Primary School Principal María Isabel Payet Business Manager Mary Nakada Director of Communications & Alumni Relations Lorena Chávez-Molina Director of Admissions & Marketing John Kurtenbach Media Center Director Michael Hancock Athletics Director John Lakatos Technology Director Cynthia Sturner Peruvian Director Administration

15
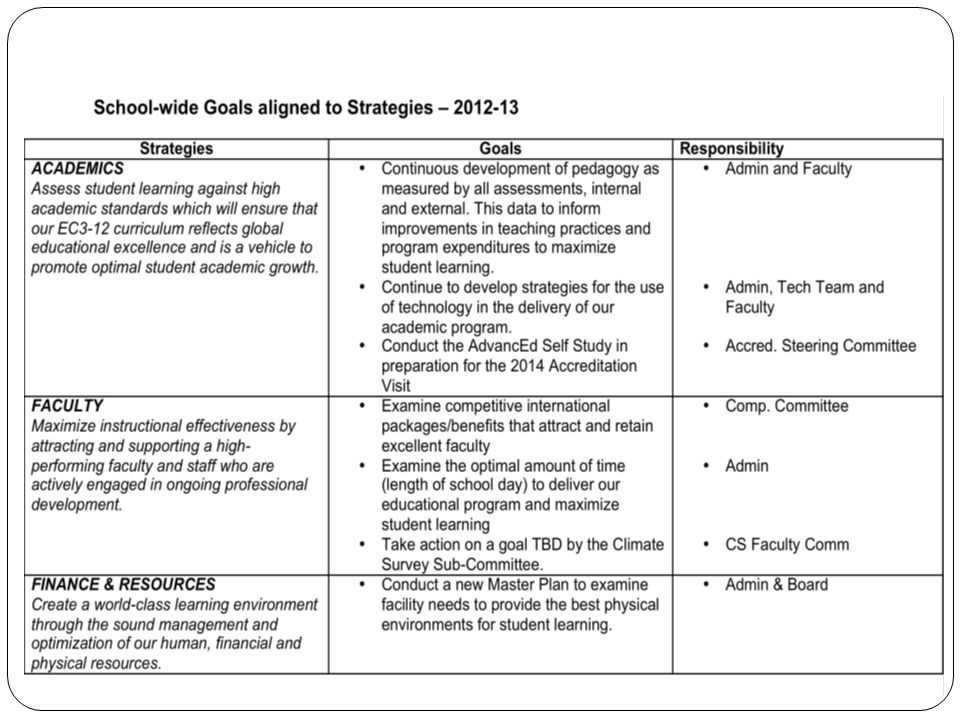
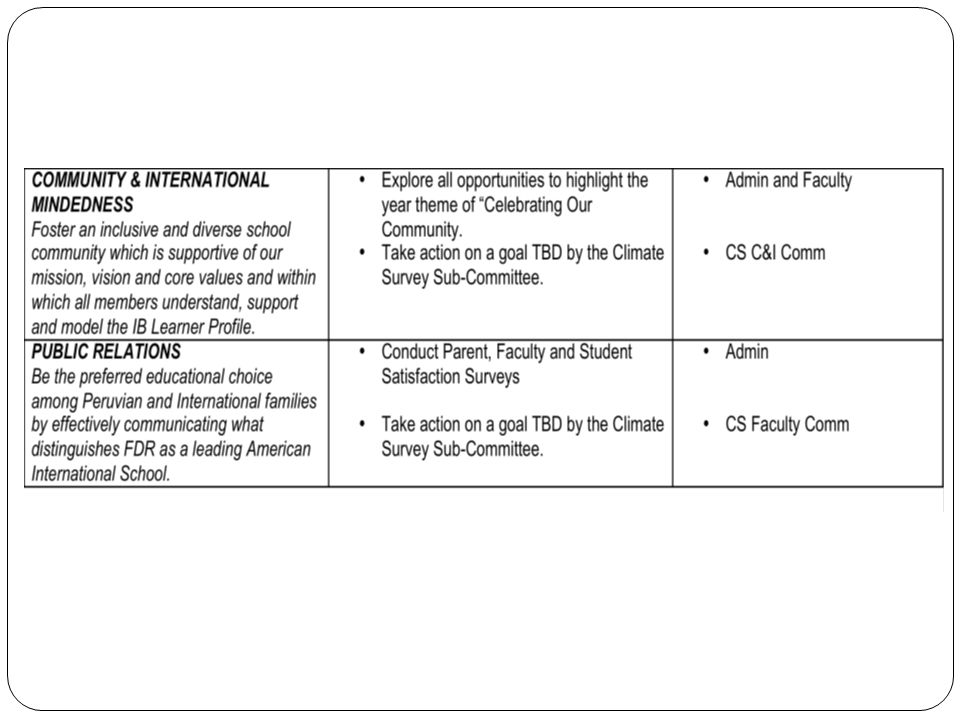
The Strategic Process

18
Initiatives and Projects 30 New Faculty and 2 New Administrators Performing Arts Center – Opening Ceremony 9/28 Scholarship Program and Theater Seat Fundraising Project Healthy Food and Drinks Removing Plastic Bottles

19
School Communications PTA Advisories & Parent Coffees Meet the Superintendent Coffees Monday Messenger & School division bulletins E-mail communications New Website this semester

20
Emergency Preparedness EQ, Fire and Lockdown Drills Evacuation Procedures GPS in School Buses Perimeter Security System First Aid and CPR Training Electronic emergency notification

21
Colegio Roosevelt’s five-year enrollment August 2007 - June 2012 Division20072008 2009 2010 2011 2012 Sem ISem IISem ISem IISem ISem IISem ISem IISem ISem II EC/K 200 203 205 204 186 194 212 215 226 225 Elementar y School 500 509 551 559 542 540 529 520 529 535 Middle School 269 265 266 316 314 321 324 344 346 High School 362 346 382 355 379 351 387 370 397 346 TOTAL STUDENTS 1331132714031384142313991449142914961491 Enrollment Trends

22
Diploma Student Information2006200720082009201020112012 Number of candidates (including Certificate) registered in the May exam session 66645662 57 10297 Number of subject entries in the session 366394403416 358 539541 Number of Diploma Program candidates (includes TOK, Extended Essay, CAS, 6 subjects) 35384240 37 5765 Number of candidates who successfully passed the Diploma 32364034 31 5459 Percentage of passing Diploma candidates 94959885849591 Mean points obtained by candidates who passed the Diploma 3432 30 3132 Mean grade obtained at FDR by candidates who passed the Diploma 5.395.075.064.85 4.91 5.055.10 Highest Diploma points awarded to an FDR candidate 42394139 40 4241 Future Projections: May 2013: 62 Diploma students (Class with 93 students) = 67% May 2014: Approx. 80 Diploma students (cohort of 119 students) = 67% IB Diploma Results
 = 67% IB Diploma Results.")
23
GRADEMAP TESTTESTING RESULTS FOR 2011 - 2012 (FDR MEDIAN RIT/USA NORM) FALL 2011 DATA SPRING 2012 DATA GRADE 3 READING196/190 (+6)205/199 (+6) LANGUAGE USAGE198/191 (+7)205/200 (+5) MATH202/192 (+10)213/204 (+9) GRADE 4 READING204/200 (+4)211/206 (+5) LANGUAGE USAGE205/201 (+4)212/207 (+5) MATH212/204 (+8)220/212 (+8) GRADE 5 READING212/207 (+5)217/212 (+5) LANGUAGE USAGE211/207 (+4)216/212 (+4) MATH224/213 (+11)234/221 (+13) GARDE 6 READING216/213 (+3)221/216 (+5) LANGUAGE USAGE218/212 (+6)220/216 (+4) MATH232/220 (+12)234/226 (+8) GRADE 7 READING222/217 (+5)225/220 (+5) LANGUAGE USAGE221/216 (+5)225/219 (+6) MATH233/226 (+7)236/231 (+5) GARDE 8 READING226/220 (+6)228/223 (+5) LANGUAGE USAGE225/219 (+6)226/221 (+5) MATH237/230 (+7)241/234 (+7) FDR DATA DASHBOARD: 2011 - 2012 MAP DATA: Data compiled by Rachel Metcalf (MAP Coordinator)
 FALL 2011 DATA SPRING 2012 DATA GRADE 3 READING196/190 (+6)205/199 (+6) LANGUAGE USAGE198/191 (+7)205/200 (+5) MATH202/192 (+10)213/204 (+9) GRADE 4 READING204/200 (+4)211/206 (+5) LANGUAGE USAGE205/201 (+4)212/207 (+5) MATH212/204 (+8)220/212 (+8) GRADE 5 READING212/207 (+5)217/212 (+5) LANGUAGE USAGE211/207 (+4)216/212 (+4) MATH224/213 (+11)234/221 (+13) GARDE 6 READING216/213 (+3)221/216 (+5) LANGUAGE USAGE218/212 (+6)220/216 (+4) MATH232/220 (+12)234/226 (+8) GRADE 7 READING222/217 (+5)225/220 (+5) LANGUAGE USAGE221/216 (+5)225/219 (+6) MATH233/226 (+7)236/231 (+5) GARDE 8 READING226/220 (+6)228/223 (+5) LANGUAGE USAGE225/219 (+6)226/221 (+5) MATH237/230 (+7)241/234 (+7) FDR DATA DASHBOARD: MAP DATA: Data compiled by Rachel Metcalf (MAP Coordinator)")
24
GRADE LEVEL% at or above Grade Level Grade 147% Grade 253% Grade 365% Grade 444% Grade 566% GRADE LEVEL% at or above Grade Level Grade 155% Grade 267% Grade 355% Grade 472% Grade 576% DRA DATA December 2011 DRA Data June 2012 DRA Results

25
Class of 2012 College Placement

26
UNIVERSITIES IN THE U.S. Adelphi University AMDA College and Conservatory of the Performing Arts American University Appalachian State University Arizona State University Babson College Baylor University Bentley College Blinn College Boston College (3) Boston University (3) Bowling Green State University Brandeis University Clark University (2) Colgate University College of the Holy Cross Colorado State University Connecticut College Cornell University Drexel University Eckerd College Emerson College International University Florida Institute of Technology Georgetown University Georgia Institute of Technology George Washington University Georgetown University George Washington UnivFlorida ersity Johnson & Wales University Louisiana State University Loyola University New Orleans Lynn University Manhattaville College Maryland Institute College of Art Miami University (2) Michigan State University (4) Middlebury College New York University (2) Northeastern University (9) Ohio State University Ohio University Pace University Pennsylvania State University (4) Purdue University Pratt Institute Rochester Institute of Technology (3) Savannah College of Art & Design (2) Stanford University Stephen F Austin State University Suffolk University Swarthmore College Texas Tech University Texas State University Trinity College University of California, Berkeley (2) University of California, Davis (3) University of California, Irvine Class of 2012 College Placement University acceptances
 Boston University (3) Bowling Green State University Brandeis University Clark University (2) Colgate University College of the Holy Cross Colorado State University Connecticut College Cornell University Drexel University Eckerd College Emerson College International University Florida Institute of Technology Georgetown University Georgia Institute of Technology George Washington University Georgetown University George Washington UnivFlorida ersity Johnson & Wales University Louisiana State University Loyola University New Orleans Lynn University Manhattaville College Maryland Institute College of Art Miami University (2) Michigan State University (4) Middlebury College New York University (2) Northeastern University (9) Ohio State University Ohio University Pace University Pennsylvania State University (4) Purdue University Pratt Institute Rochester Institute of Technology (3) Savannah College of Art & Design (2) Stanford University Stephen F Austin State University Suffolk University Swarthmore College Texas Tech University Texas State University Trinity College University of California, Berkeley (2) University of California, Davis (3) University of California, Irvine Class of 2012 College Placement University acceptances.")
27
University of California, Los Angeles University of California, Riverside University of California, San Diego (5) University of California, Santa Barbara University of California, Santa Cruz University of Colorado, Boulder University of Connecticut (2) University of Denver (2) University of Florida University of Illinois Chicago University of Illinois at Urbana-Champaign (2) University of Maryland, College Park (2) University of Massachusetts, Amherst University of Miami (2) University of Michigan (3) University of Minnesota, Twin Cities University of Nevada, Las Vegas University of New Hampshire University of North Carolina, Greensboro University of North Carolina, Wilmington (2) University of Pennsylvania (2) University of Pittsburg University of Richmond (2) University of Rochester University of San Diego (3) University of South Florida, St. Petersburg University of Southern California University of Tampa University of Texas Austin (3) University of the Pacific (2) University of Vermont University of Virginia University of Washington Vassar CollegeVirginia Polytechnic Institute Webster University Wellesley College Wesleyan University (3) Williams College Yale University UNIVERSITIES IN CANADA McGill University McMaster University University of Alberta University of Calgary University of Bristish Columbia University of Toronto University of Waterloo University of Western Ontario UNIVERSITIES IN THE UNITED KINGDOM University of St. Andrews University of Exeter University of Warwich UNIVERSITIES IN PERU Pontificia Universidad Católica del Perú Universidad de Lima Universidad del Pac’ifico Universidad Peruana de Ciencias Aplicadas Universidad San Martin de Porres
 University of the Pacific (2) University of Vermont University of Virginia University of Washington Vassar CollegeVirginia Polytechnic Institute Webster University Wellesley College Wesleyan University (3) Williams College Yale University UNIVERSITIES IN CANADA McGill University McMaster University University of Alberta University of Calgary University of Bristish Columbia University of Toronto University of Waterloo University of Western Ontario UNIVERSITIES IN THE UNITED KINGDOM University of St. Andrews University of Exeter University of Warwich UNIVERSITIES IN PERU Pontificia Universidad Católica del Perú Universidad de Lima Universidad del Pac’ifico Universidad Peruana de Ciencias Aplicadas Universidad San Martin de Porres.")
28
Financial Report 2011-2012

29
Total Income Tuition Fees Net15,801,632 Technology Fees431,307 Transportation655,256 Entrance Fees2,233,140 Other Income592,697 19,714,032

30
Operational Income Tuition15,801,632 Technology431,308 Transportation655,256 Others528,270 Total17,416,466

31
Operational Expenses Operational Costs Personnel13,968,859 Facilities Operating Expenses959,131 Instructional Supplies995,450 Non-Salary administrative expenses1,203,937 Total Operational Costs17,127,375

32
Capital Income Entrance Fees2,233,140 Others132,776 Total Capital Income2,365,916 Capital Investment5,037,733 Capital Balance(2,671,817) Initial Balance394,279 Bank loan3,000,000 Net capital balance722,462
 Initial Balance394,279 Bank loan3,000,000 Net capital balance722,462")
33
Capital Expenses Capital Investments Facilities Renovation304,585 Construction Projects4,733,148 Total Capital Investments5,037,733

34
Thank You Board Leadership Team Faculty PTA and Parents Students

Similar presentations


. m7oU.>")
