Download presentation
Presentation is loading. Please wait.

1
2 a) possible additional sources of error (creep test)
temperature not constant over time light (optical strain gages!) may be not constant humidity (sample affected!) not constant load or displacement may not be const. machine/instrument creeping creeping of strain gage etc. (day / night!)
 may be not constant. humidity (sample affected!) not constant. load or displacement may not be const. machine/instrument creeping. creeping of strain gage. etc. (day / night!)")
2
2 b) Analyzing a creep experiment
tertiary secondary primary

3
D is in the range of 8−9∙ 10 −4 1/MPa
𝐷(𝑡)= 𝜀(𝑡) 𝜎 0 creep compliance note that the values of e are given in %, so you have to divide them by 100 to evaluate creep compliance is only useful in the secondary region (marked by ) D is in the range of 8−9∙ 10 −4 1/MPa
= 𝜀(𝑡) 𝜎 0. creep compliance. note that the values of e are given in %, so you have to divide them by 100. to evaluate creep compliance is only useful in the secondary region (marked by ) D is in the range of 8−9∙ 10 −4 1/MPa.")
4
2 c) i. time-temperature-shift for master curve at 120°C
 i. time-temperature-shift for master curve at 120°C")
13
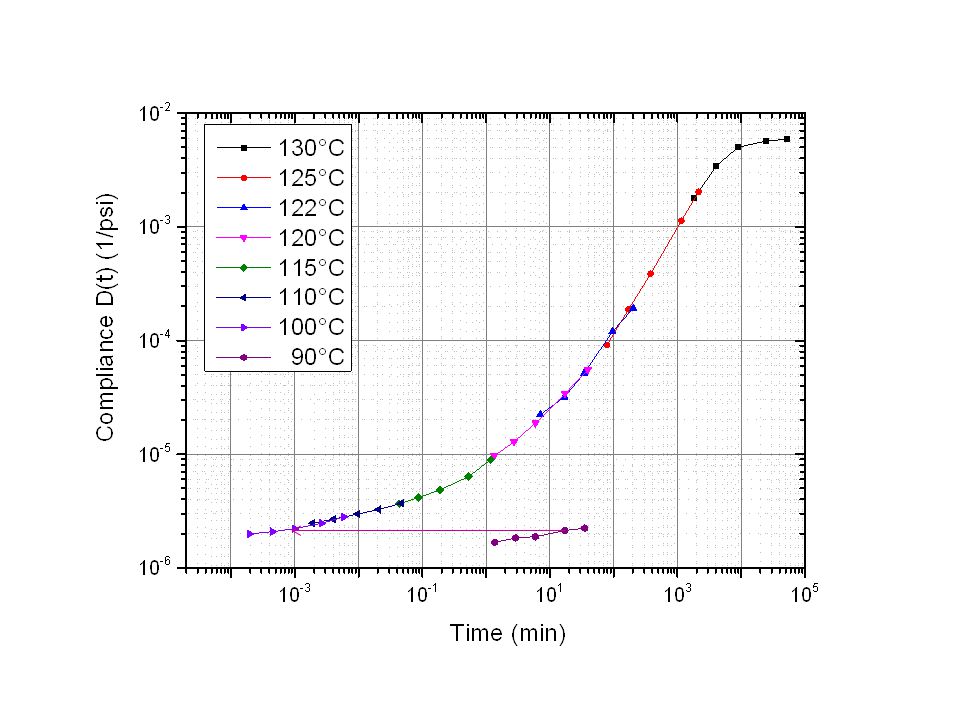
2 c) i. result: master curve at 120°C
 i. result: master curve at 120°C")
14
2 c) ii. predict compliance after 5 days
master curve at 120°C

15
master curve at 120°C 5 d = 5*24*60 min = 7200 min

16
D(5 d) ≈ 4∙ 10 −4 1/psi master curve at 120°C 5 d = 5*24*60 min = 7200 min
 ≈ 4∙ 10 −4 1/psi master curve at 120°C 5 d = 5*24*60 min = 7200 min")
17
2 c) iii. possible prediction range at 120°C
master curve at 120°C

18
master curve at 120°C 40000 min = = 0,9 months = = 0,1 years

19
for comparison: possible prediction range at 90°C
master curve at 90°C 3e+9 min = = months = = 5700 years

20
3. Fatigue testing a) three examples of applications cyclic stress loading wings of airplanes turbine blades rotor blades (nicht sehr schwer, wenn zwei davon schon in b) genannt sind)
 genannt sind)")
21
b) Wöhler curve and estimation of life time
 Wöhler curve and estimation of life time")
22
b) Wöhler curve and estimation of life time
(aim: to show that cyclic loaded components must have huge safety factors, if fatigue testing is not performed) i. N(40 MPa) ≈ 9000 ii. N(27 MPa) ≈ i. N(40 MPa) ≈ 9000 tlife = N/f = 9000 * 1 / 0,5 s = s = = 5 hours ii. N(27 MPa) ≈ tlife = N/f = * 1 / 1000 s = 300 s = = 5 minutes
 i. N(40 MPa) ≈ ii. N(27 MPa) ≈ i. N(40 MPa) ≈ tlife = N/f = 9000 * 1 / 0,5 s = s = = 5 hours. ii. N(27 MPa) ≈ tlife = N/f = * 1 / 1000 s = 300 s = = 5 minutes.")
Similar presentations


>")


 If you use 1000 watts of electricity.>")


*time + 90(m) tIme (sec) Position (meters) 45 90.>")
