Download presentation
Presentation is loading. Please wait.

1
20 Year Review of Local Government SALGA Management Committee – 12 May 2013 Presenter: Wendy Ovens

2
Overview of the Presentation Project brief Research methodology Phasing the establishment of local government Establishing the policy and legal framework Demarcating boundaries Bedding down powers and functions What about service delivery? Fiscal framework and financial management Institutionalising democracy Local Government Support programmes Overall comments

3
Project brief and research methodology The Presidency is driving the 20 Year Review regarding the country’s performance post 1994 Three focus project areas: – The local government journey post 1994 – What have been the significant achievements within the local government sector – What aspects need improvement to promote the stability, efficiency and effectiveness of local government in South Africa Todays presentation focusses on the “story line” The 20 year was largely prepared on secondary sources such as policy papers, legislation, reports and articles

4
Phasing the establishment of local government Pre 1994: Racialisation of local government peaked in mid 1980s RSCS and JSBs established to assist failing BLAs 1980s – violent protests, extensive rent and consumer boycotts Formation of slogan “one city one tax base” Establishment of local government negotiation forums – white local authorities negotiated with local civic organisation The local government negotiations one of the key sticking points in the Multi Party Negotiating Forum Local Government Negotiating Forum established – led to enactment of the Local Government Transition Act Local government to be established in three phases: – Pre interim phase – Interim phase – Final phase

5
Phasing the establishment of local government The Pre-Interim Phase 1993-1995 Negotiating forums become statutory structures Commonly referred to as “local governments of unity” Tasked with inter alia: – Determining budgets – Selecting executive committees by two third majority Important holding structures – important mechanism of creating stability Local government elections took place 1995 and in 1996 in KZN

6
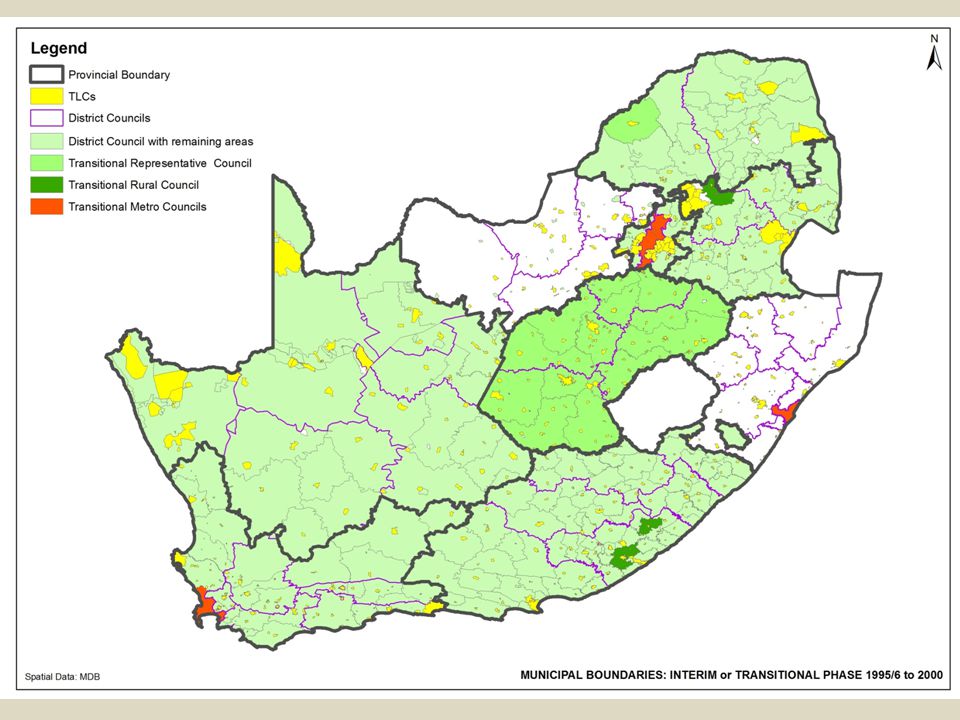
Phasing the establishment of local government The interim phase 1995 – 2000 A total of 843 transitional councils were established Again skewed racial representation – 50% of the wards had to be located in the area of the former white local authority – Wards 60% of representation – Proportional representation – 40% – Guaranteed 30% representation from former white Local Authorities Metros had two tier system – metro and substructures Transitional Local Councils – single tier Complex system of rural councils – single tier – either a district mechanism or a local one Importantly during this period – Final constitution adopted, LG policy formulated, key LG legislation drafted

7
Phasing the establishment of local government Final phase – Democratic local government Establishment of 3 categories: – Category A: Metropolitan – Category B: Local – Category C: District Established in 2000 – first term of fully democratic non-racial local government post 1994 Introduced two tier system for local government outside of metros Introduced a single tier for metros The real work of establishing effective and efficient local government The system of local government as we now know it is only 13 years old – internationally, this would be considered a very short time frame

8
Establishing the policy and legal framework Constitution Main provisions Chapter 7 of the Constitution – Bill of rights – Chapter 2 – Cooperative governance – Chapter 3 – Fiscal powers - Chapter 13 Key provisions or shifts: – “Right to govern, on its own initiative, the local government affairs of its community” – Set framework for developmental local government – Set out the categories for local government – Powers and functions – Establishment of an independent Demarcation Board – Establishment and membership of Councils – Establishment of organised local government

9
Establishing the policy and legal framework White Paper on Local Government The White Paper adequately described the challenges at local level Set out the requirements for developmental local government Addressed institutional political and administrative systems – metros and districts A strong role for district municipalities Policy framed an approach which was to be consistently applied across the country – the “ideal” or “prototype” system of local government

10
Establishing the policy and legal framework White Paper on Local Government Four years post democracy – difficult to propose a highly differentiated model Policy informed the drafting of the legislation – especially that prepared in parallel with the White Paper But shifts in policy and the manner in implementation took place has undermined the system proposed especially in relation to the district municipalities Still remains an important policy if only to allow for an understanding of the legislators intent Fundamental concepts such as developmental local government and its related components remain in place

11
Establishing the policy and legal framework Basket of local government legislation 1996 Constitution 1997 1998 2000 2003 2004 2008 Organised LG Act Demarcation and Structures Acts Systems Act MFMA Property Rates Act Fiscal Powers and Functions Act Complete redraft of local government legislation Comprehensive framework rapidly prepared Guide by Constitution and White Paper

12
Establishing the policy and legal framework Given the speed at which the drafting took place and the enormity of establishing a democratic nonracial local government, amendments were inevitable Varying types of amendments: – Ensuring Constitutional compliance – Resolving aspects for which there was insufficient legal certainty and or addressing omissions – Facilitating the implementation of the legislation and or the system of local government – Resolving operational matters – Addressing political imperatives – Strengthening aspects relating to accountability and or ensuring effective management – Creating greater efficiencies Real willingness to amend legislation – certainly in the earlier periods

13
Demarcating boundaries Transitional Councils Provincial Demarcation Boards – 50% Statutory and 50% Non Statutory Proposed boundaries to MEC MECs were empowered to amend and finalise boundaries 843 municipalities established Nearest neighbour principle was largely applied and or areas which formed part of the Local Government Negotiating Forums Local structures were not fully democratic – hence necessary for the MECs to have boundary oversight

15
Demarcating boundaries Independent Board established for the determination of boundaries Required to establish wall to wall municipalities – categories A,B and C Same system to be applied for the establishment of district and locals regardless of the following: – Socio economic conditions – Previous local government history – Capacity – Infrastructure – Ability to generate revenue Very different system – no local government building blocks rather the objectives and criteria in the Act – outer boundaries built from the enumerator areas

16
Demarcating boundaries Section 2 of the Municipal Structures Act sets out the requirements for metros The determination of the district and local municipalities largely driven by requirements of the Constitution and the Boards own policy Cross boundary municipalities established to address unresolved provincial boundary disputes

19
Demarcating boundaries Towards the 2006 local government boundary set Key issue – underperformance of the cross boundary areas Required amendments to the provincial boundary This is NOT an MDB competency – rather requires an amendment to the Constitution – driven by COGTA In addition to the amendments to accommodate the disestablishment cross boundary municipalities – also amended the provincial boundary between KZN and the Eastern Cape In light of provincial boundary changes – District boundaries amended to include local municipalities Significant resistance to Merafong inclusion into the North West and the boundary amendments in Eastern Cape and KZN Board was heavily criticised for the boundary amendments linked to the provincial boundary changes – start of the slow discrediting of the MDB

21
Demarcating boundaries Towards the 2011 local government boundary set 3 key decisions – Determination of two additional metros – Removal of the district management areas – District municipalities should have 3 or more local municipalities to allow for greater efficiencies Originally, Buffalo City, Mangaung and Msunduzi were proposed – latter withdrawn as KZN request the entire district form part of the metro Alfred Nzo DM expanded to 4 local municipalities and Metsweding disestablished and absorbed into Tshwane metro

23
Demarcating boundaries The demarcation of the outer boundaries took place within a 12 month period This did not allow for careful consideration of each and every boundary Over the last 12 years, the process of refining municipal boundaries has been undertaken The 1999 boundary demarcation elicited 4 legal challenges, some of which were dropped there were no protests linked to the boundaries The uprising post the 2006 demarcations were an early indication of the community perceptions with respect to the importance of outer boundaries The recent protests re the proposed amalgamation of Metsimholo and Ngwathe Local Municipalities is an indication of the challenges that may be faced with any future major re-demarcations

24
Demarcating boundaries Local politics and community perceptions are intertwined with growing concern about the independence of the Demarcation Board Boundaries are now increasingly becoming closely guarded by communities and political interests Anecdotally, it would appear that it takes approximately 2 years for a municipal area to settle post a major re-demarcation Such disruptions negatively impact service delivery creating local uncertainty and discontent A number of significant demarcation questions remain which includes addressing the so called non-viable municipalities and establishing further single tier (category A) municipalities
 municipalities")
25
Bedding down powers and functions Interim phase Board powers and functions outlined in the interim Constitution “local government shall, to the extent determined in any applicable law, make provision for access by all persons residing within its area of jurisdiction to water, sanitation, transportation facilities, electricity, primary health services, education, housing and security within a safe and healthy environment, provided that such services and amenities can be rendered in a sustainable manner and are financially and physically practicable Details left to MECs to publish Local Government Transition Act – outlined P&Fs for Metros and substructures Contained a number of functions previously performed by white local authorities – such as libraries and ambulances

26
Bedding down powers and functions Local government powers and functions outlined in Schedule 4 Part B and Schedule 5 Part B of the Constitution Metro has all of these functions Section 84 of the Municipal Structures Act provides for the division of powers and functions for local and district municipalities District municipalities functions in the Structures Act reflect the intentions of the DC role as outlined in the White Paper Possible assignment of functions from national and provincial govenment

27
Bedding down powers and functions Implementing the division of powers and functions Instead of “taking the plunge” and allowing the system to come into effect – An amendment to the Structures Act was made to allow the newly established municipalities in 2000 to continue performing the “status quo” The main reason was to ensure that municipalities were able to stabilise their structures and systems prior to any major reorganisation of powers and functions Key shift in policy: – Adjustment of the water and sanitation to 25 district municipalities – Change in the definition of Municipal Health Services – to environmental health only – Electricity – status quo to be retained

28
Bedding down powers and functions MECs functions – Largely based on the MDBs capacity assessment undertaken in 2002/03 – Some provinces opted to make very few adjustments – WC – Some implemented own policy – for example – the district to perform the entire fire fighting function – Limpopo – MDB annual capacity assessment done until 2008/09 with recommendations to MECs – ongoing adjustments – Attempt to move closer to powers and functions as outline in Section 84 MDB prepared a report outlining the norms and standards for municipal functions to assist with the capacity assessment process

29
Bedding down powers and functions District adjustments – Feb 2009 LM Adjustments – Feb 2009 (Most common) Adjustment Total 84(1)(e) - Solid waste111 84(1)(f) - Roads73 84(1)(h) - Airports31 84(1)(j) Fire Fighting46 84(1)(k) Markets and Abattoirs 4 84(1)(k) Abattoirs only4 84(1)(k) Markets only10 84(1)(l) Cemeteries99 84(1)(m) Local tourism15 Fire Fighting 55 Municipal public transport 25 Local tourism 22 Licensing and control of undertakings that sell food to the public 19 Building regulations 11
 Adjustment Total 84(1)(e) - Solid waste111 84(1)(f) - Roads73 84(1)(h) - Airports31 84(1)(j) Fire Fighting46 84(1)(k) Markets and Abattoirs 4 84(1)(k) Abattoirs only4 84(1)(k) Markets only10 84(1)(l) Cemeteries99 84(1)(m) Local tourism15 Fire Fighting 55 Municipal public transport 25 Local tourism 22 Licensing and control of undertakings that sell food to the public 19 Building regulations 11")
30
Bedding down powers and functions Division of Powers and Functions – reflections Implementation has allowed for a number of distortions or problems to creep into the system. Instead of allowing the district and local municipalities to perform their functions as envisaged in the Municipal Structures Act immediately post the 2000 elections, the status quo was retained This meant that a number of municipalities, which were not performing the function in 2000, failed to develop capacity The MECs adjustments were then made on the capacity assessment which was based on the “status quo”. Consequently the proposed system for district municipalities was not truly tested in some areas.

31
Bedding down powers and functions Division of Powers and Functions – reflections continued Errors made in the publication of adjustments due to a lack of capacity at Provincial level Lack of understanding of the adjustment process resulted in the bouncing of functions from one tier to another in a manner which undermined service delivery. There was no framework for guiding the frequency of adjustments – consequently done annually by some provinces without considering the implications Adjustments made but with no capacity in place – for example firefighting in the Limpopo province While overtime – municipalities demonstrated an improvement in the overall number of functions performed with some capacity in some provinces as decline was found

32
Bedding down powers and functions Municipalities performing provincial or national functions A number of functions were historically performed by especially large white local authorities with the practices continuing into the interim phase such as ambulances, libraries, museums and environmental conservation. Health services included the provision of primary health care services Post 2000, many provinces have struggled to “provincialise” many of these functions. Some provincial functions are performed by municipalities – On an agency basis or delegated responsibility – The practice remains but without a coherent agreement in place. Are some instances where municipalities are required to cross subsidise the functions being performed at the local level Assignments by way of legislation have in a number of instances been ad hoc, without adequate consultation, placing a burden on local governments without the necessary supporting resources.

33
Bedding down powers and functions Challenges with the current powers and functions framework There are a number of functions that span all three spheres of government eg. – Roads – Health services – Planning and land use management and – Transport The overlaps tend to lead to duplication in service provision and a lack of clarity in relation to who is responsible for what aspect of the function and where No coherent set of legislated function definitions A number of functions allocated to provincial and national government which would be better located at the local level for example the housing function – hampered effective planning but also project implementation As municipalities continue to perform provincial functions, provincial and national government have also assumed the responsibility for some of the local government functions The on-going adjustments have also resulted in considerable local uncertainty

34
Bedding down powers and functions Rethinking Powers and Functions There is the need to urgently develop a rational division of powers and functions for supporting and promoting developmental local government. A framework needs to be adopted at national level for ensuring the appropriate alignment of functions in support of the overall mandates of provinces, districts, local and metropolitan municipalities. The principal of subsidiarity must be applied in the assignment of functions. Attention must be given to the specific requirements for promoting urban and rural development. This requires a rational but differentiated approach to the allocation of functions Those functions which were historically performed at the local level, are yet to be provincialized should remain at the local level such as libraries, local museums and the licensing of vehicles

35
What about service delivery? Introducing Integrated Development Planning 5 year plan – we are now into the 3 rd cycle First IDPs in 2000 – DPLG prepared manual and established support centres IDPs are an important tool for guiding and justifying infrastructure development Means of assessing municipal performance All municipalities now comply with the legislative requirements for preparing IDPs Quality still remains a challenge – products are mechanistic and process driven planning approaches

36
What about service delivery? Few IDPs reflect strategic considerations: National and provincial development goals, priorities and challenges A shared perspective of the district or metropolitan space economy Strategic alternatives for addressing district or metro based developmental challenges The management of difficult choices and trade-offs regarding infrastructure investment and development spending priorities Agreements with national and provincial sectors and line departments with respect to infrastructure investment and development spending within their shared area of impact Challenges with linking IDPs and SDFs

37
What about service delivery? Selecting the appropriate service delivery mechanism – Internal – External but: Some municipalities have completed section 78 investigations but many have not Are challenges with the use of entities Shared Services Model – Growing practice especially in the Western Cape and KZN – Used extensively for supporting the Operation Clean Audit

38
What about service delivery? Municipal Capacity Levels The MDB Capacity Assessments overtime have demonstrated large variations in staffing levels for different types of municipalities. The 2008/09 capacity confirmed that at local municipal level the B1 municipalities had significantly higher staffing levels when compared with B4 and B3 municipalities B1 experienced a slight decrease in staffing levels from 2002/03 to 2008/09 B3 had the largest increase and have improved their staffing levels by approximately 38%. B4 experienced the highest improvement, (77%) in the staff to household ratio when compared to the other classifications of municipalities - the 2002/03 to the 2008/9 assessment periods. B3 demonstrated a 58% improvement with the classification The improvement in staff to household ratio indicates a strong positive trend especially in some of the poorest regions of South Africa
 in the staff to household ratio when compared to the other classifications of municipalities - the 2002/03 to the 2008/9 assessment periods. B3 demonstrated a 58% improvement with the classification The improvement in staff to household ratio indicates a strong positive trend especially in some of the poorest regions of South Africa.")
39
What about service delivery? Municipal Capacity Levels continued The 2011 MDB capacity assessment results indicate that in the B4 municipalities - approximately 71% of the operating expenditure with 41% of the staff being allocated to governance and administration Approximately 29% expenditure but with 59% of the staff are allocated to service delivery. This is a significant variation when compared with B2 and B3 municipalities which have between 36-38% operating expenditure allocated to governance and administration B1 municipalities and metros showing results of 17% and 18% operating expenditure for G&A respectively

40
What about service delivery?

44
When examining the census results for 2001 and 2011, it is apparent that significant progress has been made in relation to addressing the basic service backlogs. Those functions for which other agencies are part of the delivery process, such as Eskom and water boards, greater progress appears to have been made Refuse removal which has largely remained a service rendered by the municipality only, less progress has been found. It should be noted that in some areas especially in the so called B3 and B4 municipalities, such services were only introduced within the last 10 years with the municipalities still needing to develop the necessary capacity.

45
What about service delivery? Service Delivery Protests (Powell 2012) Average protest per month: 2007 – 8.73 2008 – 9.83 2009 – 19.18 2010 – 16.33 Increasingly prone to violence 2007 – 42% 2008 – 38% 2009 – 44% 2010 – 54% Other kinds of protest – 70 towns nationally have declared a dispute
 Average protest per month: 2007 – – – – Increasingly prone to violence 2007 – 42% 2008 – 38% 2009 – 44% 2010 – 54% Other kinds of protest – 70 towns nationally have declared a dispute.")
46
DeVisser and Powell – Service Delivery Protest Barometer 2007 – 2012 (www.migi.org.za)

48
Fiscal framework and financial management Implementing the Local Government Equitable Share In 1998, a decision was taken by the then Department of Finance to determine the equitable share based on a formula to ensure that the allocations were – objective – transparent – scientific and – beyond manipulation by policy makers or municipalities Two formulae operationalised – Basic service – (S) grant – Municipal Institutional - (I) grant Number of changes occurred during this period – Formula reviewed in 2004 and implemented in the 2005/06 year Again changes – and the formula is once again under review
 grant – Municipal Institutional - (I) grant Number of changes occurred during this period – Formula reviewed in 2004 and implemented in the 2005/06 year Again changes – and the formula is once again under review")
49
Fiscal framework and financial management FFC 2012/13

50
Fiscal framework and financial management LG in South Africa is largely self-financing – ability to minimise consumer debt is critical Non-payment occurs from a number of sources including households, businesses, government and other more minor sources. The FFC analysis of municipal consumer debt from 2004/05 to the 2009/10 financial periods demonstrates that the consumer debt levels are slowly decreasing. However, two categories of municipalities namely the secondary cities and the “districts with major powers” are showing rising levels of debt Metros have just under R4 Billion consumer debt Remaining challenges include: – Inadequacy of the municipal billing systems – Poor metering – Lack of affordability – High tariffs

51
Fiscal framework and financial management Extracted from AG Reports

52
Fiscal framework and financial management In 2009, the key financial management challenges identified by the Auditor General included: Inadequate skills on planning, budgeting: public financial management including expenditure management Poor interface between financial and non-financial information Inability to manage cash flow significantly Inadequate skills on credit and debt management, including basic financial accounting and filling or record keeping in most instances Duplication of payments in some instances and amounts not accounted for (lack of financial accountability) Lack of systems to manage audit queries and recommendations, both internal and external auditing Inadequate systems with regard to corporate governance
 Lack of systems to manage audit queries and recommendations, both internal and external auditing Inadequate systems with regard to corporate governance")
53
Fiscal framework and financial management Operation Clean Audit introduced in 2009 as part of the LGTAS - In the 2010/11 audit: Have been marginal improvements in the number of clean audits Minimal improvement for IT controls and HR capacity No improvement supply chain management Increase in irregular expenditure from R3 Billion in 2008/09 to R7 Billion in 2010/11

54
Institutionalising democracy Ware delimitation process Period Growth in the number of registered voters Actual number of additional wards nationally Percentage in the increase in the wards nationally 2000 – 2006 (3753)14%1423.8% 2006 – 2011 (3895)12.8%3829.8% 2000 – 2011 (4277)28.6%52414% Process and delimitation of wards remains a major problem Many actors in the process – Minister, MECs and MDB
14%1423.8% 2006 – 2011 (3895)12.8%3829.8% 2000 – 2011 (4277)28.6%52414% Process and delimitation of wards remains a major problem Many actors in the process – Minister, MECs and MDB")
55
Institutionalising democracy A growing concern has been the constantly changing ward boundaries from one electoral period to the next Generally ward boundaries have greater stability in low density or commercial farming areas. Significant shifts were found in the Northern and Western Cape in the last election due to the disestablishment of the District Management Areas. High population density areas such as the metros and the traditional authority areas, which include the Eastern Cape, KwaZulu-Natal, Mpumalanga, Limpopo and North West, demonstrate higher levels of ward “instability” or mobility. MDB has lost significant credibility over the ward delimitation process but there are a number of role-players influencing the ward outcomes: – Minister for Cooperative Governance – determination of the formula – MECs who can vary the formula – Once received by the MDB – number of registered voters per ward is set – MDB is then responsible for configuring the ward

56
Local Government Support programmes A number of local support programmes have been implemented over time such as: – ISRDS – CMIP – Project Consolidate – Urban Renewal Programme – Local Government Turnaround strategy – Operation Clean Audit

57
Establishing SALGA Pre 2000 The Organised Local Government Act enacted in 1997: – prior to the finalisation of the Local Government White Paper and – the introduction of the basket of local government legislation. 843 transitional local structures were in place - the decision was taken that provinces be responsible for organising and supporting local government Post 2000 The Act contained no description of the roles and responsibilities for OLG Roles and responsibilities has been spread across a wide range of legislation including the Constitution, Municipal Systems Act, Municipal Finance Management Act and the Intergovernmental Relations Act. In 2000 - municipality numbers reduced – massive spatial reconfiguration New structures and systems Many councillors into the LG system for the first time It was in this context that SALGA had to establish itself

58
Establishing SALGA Key decisions were made in the early 2000s such as the establishment of SALGA as a unitary structure SALGA’s key strength is its strong legal and constitutional mandate, which gives it access to the highest decision making bodies in government Significant challenges posed by provincial associations such as KWANALOGA, FREELOGA and WECOLOGO were resolved through consistent and dedicated negotiation and intervention. It took 15 years from the point of SALGA’s establishment in 1996 before it emerged as a unified structure in which all provincial associations and municipalities participated. The unfolding of SALGA’s mandate, by way of legislation, took approximately 11 years. This has required the organisation to be flexible with the capacity to absorb and respond to change as it has occurred.

59
SALGA – Progress Made Research demonstrates a significant maturing of the organisation’s ability to engage with its mandate. Employer body responsibility: – Introduce multi-year agreements, now into its fourth cycle, – Introduced a sophisticated wage curve for different categories of municipalities – Other collective bargaining agreements. – Reduction in the number of registered medical aids from in excess of 50 to a mere 6. – Substantial gains toward the establishment of a single pension fund for local government. Handbooks and training on the management of labour relations have been developed and introduced

60
SALGA – Progress Made Representing the interests of Local Government The organisation has gained prominence in representing local government on the implementation of policy affecting local government. A number of oral representations have been made regarding the introduction of Bills impacting the sector. SALGA’s participation in the NCOP has gained respect overtime This is reflected in the organisation successfully lobbying to host the NCOP Local Government Week in 2012.

61
SALGA – Progress Made Capacity building Initiatives have been extensive The highest number of recorded training sessions, in excess of 17000, being held in the 2011/12 period. It is widely acknowledged internationally that the support of local government is vitally important for managing migration, rapid urbanisation and the growth of towns and cities which is taking place, especially within the African Continent. SALGA remains the strongest and most well-resourced organised local government association within Africa and as such has and continues to have an important role to play.

62
SALGA – Challenges Urgent need to review SALGAs mandate – fragmented in legislation – overlapping in responsibilities – Mandate has increased overtime – not matched with increased resources for implementing mandate Unitary Structure – Current legislation no longer reflects practice – Way the current legislation is draft makes the organisation vulnerable SALGA is currently a Section 3a Entity – The organisation does not fit the definition – SALGA is required to report in terms of the PFMA – Attempts to get the organisation de listed as a Section 3a entity

63
SALGA Challenges Financial Vulnerability SALGA is increasingly becoming dependent on membership levies as its core source of revenue – Approximately 90% from this source in the 2011/12 financial year. – Given the voluntary nature of the organisation and the financial challenges faced by many municipalities

64
SALGA Challenges Impact of Capacity Building: The focus on capacity building has been an important part of SALGA’s work over the last 15 years. Questions remain as to whether the training programmes are delivering the desired outcomes. Given that capacity building is one of SALGA’s key functions, it is necessary for the organisation to re-evaluate current approaches to capacity building programmes in the sector Needs to drive a more coherent high impact programme whose outcomes are measurable over time.

65
Overall comments – Deracialising local government Progress SA moved from a highly fragmented racial based system of local government to integrated democratic system Shifted from tiers to sphere of government Uniform system of wall to wall municipalities Structures established in areas with little or no history of local government Shifted responsibility for service provision from Traditional Authority to municipality Challenges Uniform system does not sufficiently allow for the effective management of the so called non viable areas Tensions between municipalities and traditional authorities in some areas Significant capacity challenges remain

66
Overall comments – Formulating the policy and legal framework Progress RDP set basic service standards Key policy document – White Paper on Local Government Legal framework based on White Paper and Constitutional obligations Comprehensive basket of legislation prepared – massive undertaking Legislative environment has been vibrant, responsive with government willing to make amendments Challenges Aspects in the legislation remain problematic – such as the division of powers and functions Some of the foundations for the system proposed – removed – eg. RSC levy with no suitable replacement – undermined the district system Some of the legislation remains onerous – section 78 investigation process Inadequate recognition of differentiation

67
Overall comments – Demarcation Progress Establishment of an independent Municipal Demarcation Board Rationalised 843 interim structures into 284 Metro, District and local councils Initial demarcation completed within a single year – international first! Cross boundary municipalities have been removed Additional metros increased from 6 – 8 District management areas removed Challenges What to be done with the so called non viable municipalities – urgent need for differentiation – the solution MAY NOT be a demarcation one Need to consider additional category A municipalities – requires an amendment to section 2 of the Act MDB losing credibility – need to improve its public consultation and communication methods Need to consider the ward delimitation process Urgent need to review the demarcation criteria

68
Overall comments – Powers and Functions Progress Constitution outlined the powers and functions for local government MDB capacity assessments do indicate a slow but steady settling into the rendering of powers and functions allocated Challenges MECs adjustments made and the process attached Some municipalities still performing provincial functions for historical reasons Concurrent functions – roles and responsibilities not sufficiently clear Wide variations in the number and quality of services rendered across municipalities – Metros and B1 – wide range of functions B3 and B4 municipalities very few functions – wide capacity variations Need to review what functions should be at the local sphere of government – differentiated approach

69
Overall comments – Service Delivery Progress Business as usual as major restructuring and transformation of local government took place IDPs introduced – 3 rd IDP cycle Significant progress in addressing backlogs especially, water sanitation and electricity Progress in determining service delivery mechanisms Growing body of knowledge on the use of entities Shared service model being implemented Some signs of improved capacity Challenges Backlogs remain a major problem in some areas – specifically B4 Inadequate grant provision made for the provision of services – impacts service delivery Capacity remains a challenge – are variations across municipalities Skilled and professional staff shortages Maintenance of infrastructure remains a problem Increasing levels of consumer dissatisfaction – increasing numbers of service delivery protest

70
Overall comments – Fiscal Framework and Financial Management Progress Equitable share introduced – onto its third major revision Municipal Finance Management Act introduced Slow adherence to the provisions of the Act MDB capacity results – CFOs tend to be better qualified with longer experience within the local government sector Operation Clean Audit starting to show some positive results Challenges Number of issues in relation to the Equitable share to be addressed The number of disclaimer or adverse opinions remains despite the decline over time Consumer debt remains a problem Significant increase in irregular expenditure – 3 to 7 Billion in a three year period Corruption and fraud a major and growing problem

71
Pressing issues to be addressed emerging from the 20 year review Rethinking the role of the district municipality Resolving aspects relating to powers and functions – Division of powers and functions – Assignment of provincial and national functions – Addressing aspects relating to concurrency – Reconsidering functions to be performed at local level – Implementation of a differentiated approach – Resolving the adjustment process Improving intergovernmental relations especially in relation to planning and implementation Need to address service delivery especially in the B3 and B4 municipalities Complete and implement the revision of the Equitable Grant formula Increased efforts linked to Operation Clean Audit Improving accountability and intervention

72
THANK YOU

Similar presentations


 12 April 2012 Presenter: Dr Patrick Sokhela.>")


 CoGTA driven process Water Sector Leadership Group 18 November 2009 1.>")


 National Department of Public Works Presentation to the Select Committee.>")
>")

 Projects and.>")

![The Urban Infrastructure Challenge in Canada: Focusing on Housing Affordability and Choice Presentation by CHBA – [Name] to The Municipal Council of [Name]](/17/5358765/big_thumb.jpg "The Urban Infrastructure Challenge in Canada: Focusing on Housing Affordability and Choice Presentation by CHBA – [Name] to The Municipal Council of [Name]>")