Download presentation
Presentation is loading. Please wait.

1
Key Performance Indicators KPI’s

4
Purposes of (KPI’s) Performance Measurement Systems
Providing direction and support for continuous improvement Identifying trends and progress Facilitating understanding of cause-and-effect relationships Allowing performance comparison to benchmarks Providing a perspective of the past, present, and future

5
Key Task In designing a performance measurement system, organizations must consider how the measures will support: Senior executive performance review Organizational planning Address the overall health of the organization, and How the measures will support daily operations and decision making.

6
Key Issues Organizations need comparative data, such as:
Industry averages Best competitor performance As well as world-class benchmarks to gain an accurate assessment of performance and know where they stand relative to competitors and best practices.

8
KPI’s & Shareholder Value
Shareholders invest to make money. Management invest that money to achieve the objectives of the shareholders. KPI’s should focus on achieving the objectives of the shareholders but not ignore the other stakeholders.

10
KPI’s Practical Guidelines
Fewer is better. Link to the key business drivers. Include a mix of past, present, and future Address the needs of all stakeholders. Start at the top and flow down to all levels of employees Combine multiple indexes into a single index Change as the environment and strategy changes Have research-based targets or goals

12
Linkages to Strategy KPI’s Measures and indicators
Key business drivers (key success factors) Strategies and action plans KPI’s Measures and indicators
 Strategies and action plans. KPI’s Measures and indicators.")
13
KPI’s - Measurements Does the measurement support our mission?
Will the measurement be used to manage change? Is it important to our customers? Is it effective in measuring performance? Is it effective in forecasting results? Is it easy to understand and simple?

14
Key objective The things an organization needs to do well to accomplish its vision are often called: key business drivers or key success factors. They represent things that separate an organization from its competition and define strengths to exploit or weaknesses to correct.

15
Key Criteria Good measures and indicators are actionable
They provide the basis for decisions at the level at which they are applied.

16
Customer Measures Customer satisfaction and dissatisfaction
Customer retention Gains and losses of customers and customer accounts Customer complaints and warranty claims.

17
Product and Service Measures
Internal quality measurements Field performance of products Defect levels Response times

18
Human Resource Measures
Employee satisfaction Training and development Work system performance and effectiveness Safety Absenteeism Turnover of Staff (longevity of employees)
")
19
Organizational Effectiveness Measures
Cycle times Production flexibility Lead times and setup times Time to market Product/process yields Delivery performance Cost efficiency Productivity

20
Governance and Social Responsibility Measures
Organizational accountability Ethical behavior Regulatory/legal compliance (ISO 9000) Community service
 Community service.")
22
Common Production Quality Measures
Defects per unit of Production Errors per opportunity Customer returns Patient or Customer Waiting Times Production per employee Sales per square metre

23
Creating Effective Performance Measures
Identify customers requirements and expectations Define work processes Define value-adding activities and process outputs Develop measures for each key process Evaluate measures for their usefulness

25
Analyzing and Using Data
Analysis – an examination of facts and data to provide a basis for effective decisions. Examples Examining trends and changes in key performance indicators Making comparisons relative to other business units Calculating means, standard deviations, and other statistical measures Seeking to understand relationships among different performance indicators

26
The Cost of Quality (COQ)
COQ – the cost of avoiding poor quality, or incurred as a result of poor quality Translates defects, errors, etc. into the “language of management” – $$$ Provides a basis for identifying improvement opportunities and success of improvement programs

27
Managing KPI’s and Information
Validity – Does the indicator measure what it says it does? Reliability – How well does an indicator consistently measure the “true value” of the characteristic? Accessibility – Do the right people have access to the data?

29
Common Operating Ratios for the Hotel Industry
Average room rate (ADR) Revenue per available room (RevPAR) Revenue per available customer (RevPAC) % room occupancy Average Food Service Check Seat Turnover (Covers)
 Revenue per available room (RevPAR) Revenue per available customer (RevPAC) % room occupancy. Average Food Service Check. Seat Turnover (Covers)")
30
Call Centre KPI’s

35
Questions Suggest suitable KPI’s for an airline.
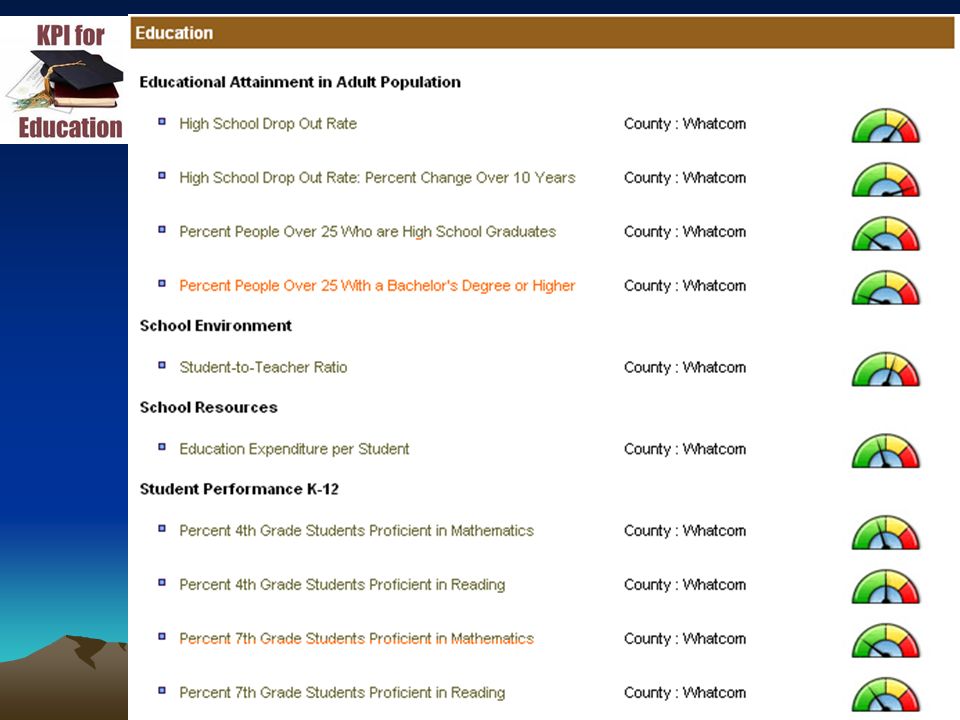
Suggest suitable KPI’s for the retail sector. Suggest suitable KPI’s for the legal profession. Suggest suitable KPI’s for schools & colleges. Suggest suitable KPI’s for a manufacturer.

36
Improving Operational Performance
A Medical Practice – Worked Example

37
Patient Care Response Times Clinical Performance Customer Service

38
Employee Wellbeing Retention Health / Safety / Welfare Satisfaction
Compensation Recruitment

39
I’m ready for some leisure time.
Bye for now! I’m ready for some leisure time. Please ensure you Prepare for next session 39

Similar presentations


>")


. Key Concepts Managerial Cognition Business Model Stakeholders The Balanced Scorecard.>")


