Download presentation
Presentation is loading. Please wait.

1
Submitted by: Javaneh Noorparvar Civil Engineering, Cal Poly Pomona

2
General Background Rubbernecking Objective Area of Study Data Analysis Mechanical System Part 1 Part 2 Triangle Theory Results Questions

3
Los Angeles ranks highest in total and per-capita congestion delays every year. 60% of all traffic congestion is due to incidents. Accidents (vehicle to vehicle or vehicle to object)
.")
4
What is it? Rubbernecking is when drivers on the opposing side of an incident are curious and distracted by the incident, therefore slowing down. Leads to congestion and/or accidents

5
This study concentrates on creating a mechanical system that identifies bottlenecks due to rubbernecking and evaluates the impacts they have on speed reduction.

6
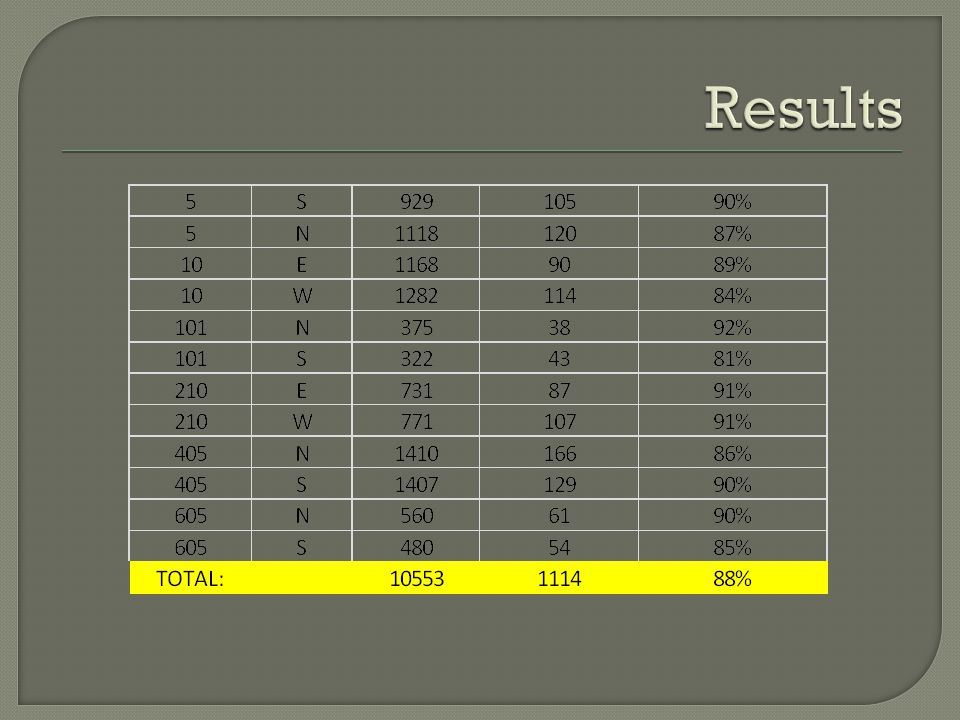
Interstate 5 Interstate 10 Highway 101 Interstate 210 Interstate 405 Interstate 605

7
PeMS (http:pems.dot.ca.gov/) Historical Real-Time Traffic Data Timestamp, station, District, Freeway #, Direction of Travel, Total Flow, Average Speed… ext. Incident Data

8
Microsoft Visual Studio Identifies Bottlenecks Caused by rubbernecking. Part One Locates the opposing side of traffic and collects it’s real time traffic data. Part Two Analyzes the data and determines where bottlenecking had a major effect on the traffic speed.

9
Two databases were created One has four tables Freeways Table Stations Table Speed date Table Incidents Table Five-Minute data

13
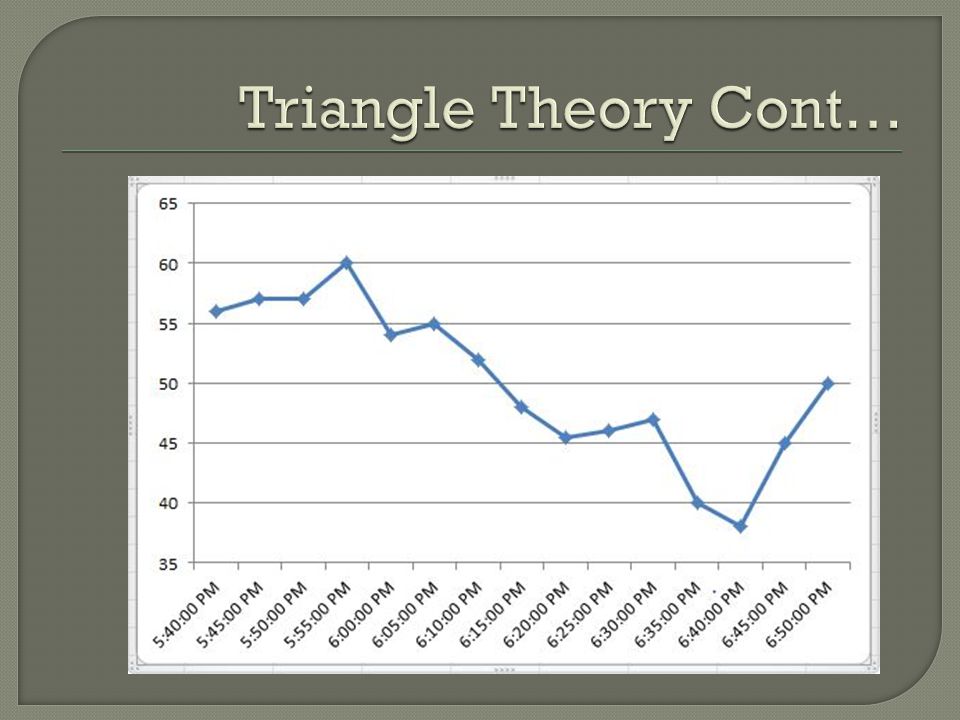
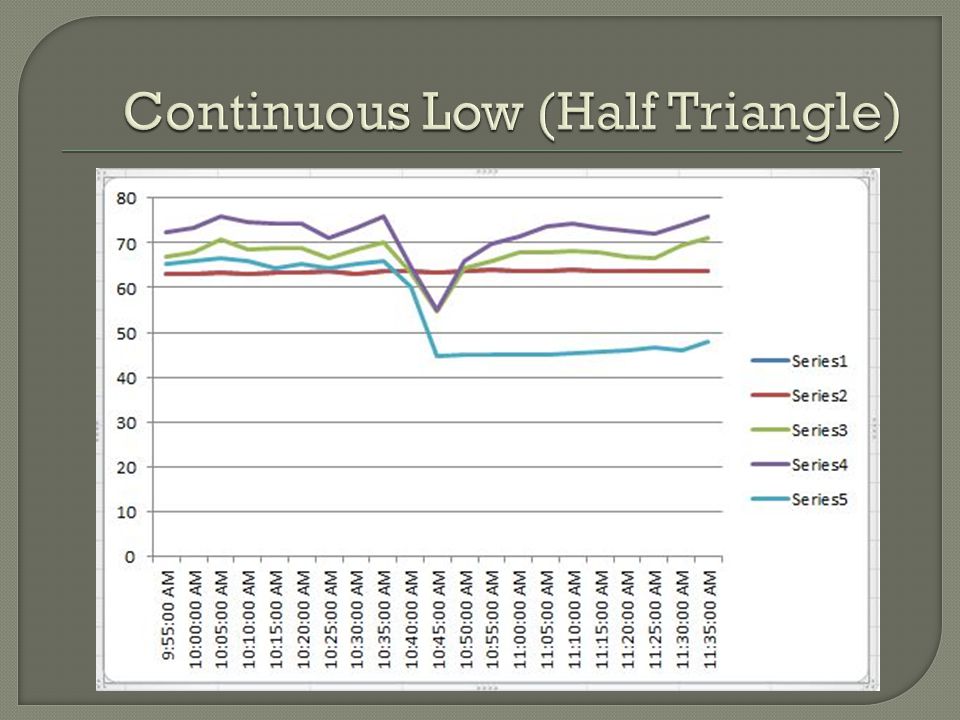
Find possible accident station Find possible accident start time Search for occurrences of bottleneck

19
Parameters: Start Date: January 2, 2011 End Date: December 30, 2011 Minimum Duration: 30 minutes Maximum Duration: 600 minutes Days: Monday through Friday Length Before incident: 2 miles Length After incident: 2 miles

21
David M. Freese

Similar presentations


 and.>")


>")


 Vehicle 1 u 1 = 50 mph (constant) Distance Time Fix Point in.>")

