Download presentation
Presentation is loading. Please wait.

1
Example Science Applications of SABER Processed Data

2
NLTE SABER zonal mean temperature July 4, 2002 showing double mesopause structure NLTE temperature shows double mesopause structure NLTE LTE LTE temperature shows little double mesopause structure (Mertens et al, 2003)
")
3
SABER data show presence of mesospheric chemical heating on June 4, 2002 20 K/day 5 K/day Chemical heating present every day of yaw period analyzed for May – July, 2002 H + O 3 O + O + M O + O 2 + M

4
SABER (m,f) Spectra at ~71 km show “quasi-2-day” wave (Garcia, 2003) Large 2-day wave amplitudes are seen around summer solstice Variance is present along a line of constant phase speed; largest for m = 3, 4 near 0.5 cpd c ~ 70 m/s Jan-Feb 2002 at 36 SJun-Jul 2002 at 36 N c~70 ms - 1
 Spectra at ~71 km show quasi-2-day wave (Garcia, 2003) Large 2-day wave amplitudes are seen around summer solstice Variance is present along a line of constant phase speed; largest for m = 3, 4 near 0.5 cpd c ~ 70 m/s Jan-Feb 2002 at 36 SJun-Jul 2002 at 36 N c~70 ms - 1")
5
SABER “quasi-2-day” wave amplitude for 2002 and 2003 (Garcia, 2004) =3, June 15-July 14, 2002 =3, June 14-July 14, 2003 =4, June 15-July 14, 2002 =4, June 14-July 14, 2003
 =3, June 15-July 14, 2002 =3, June 14-July 14, 2003 =4, June 15-July 14, 2002 =4, June 14-July 14, 2003")
6
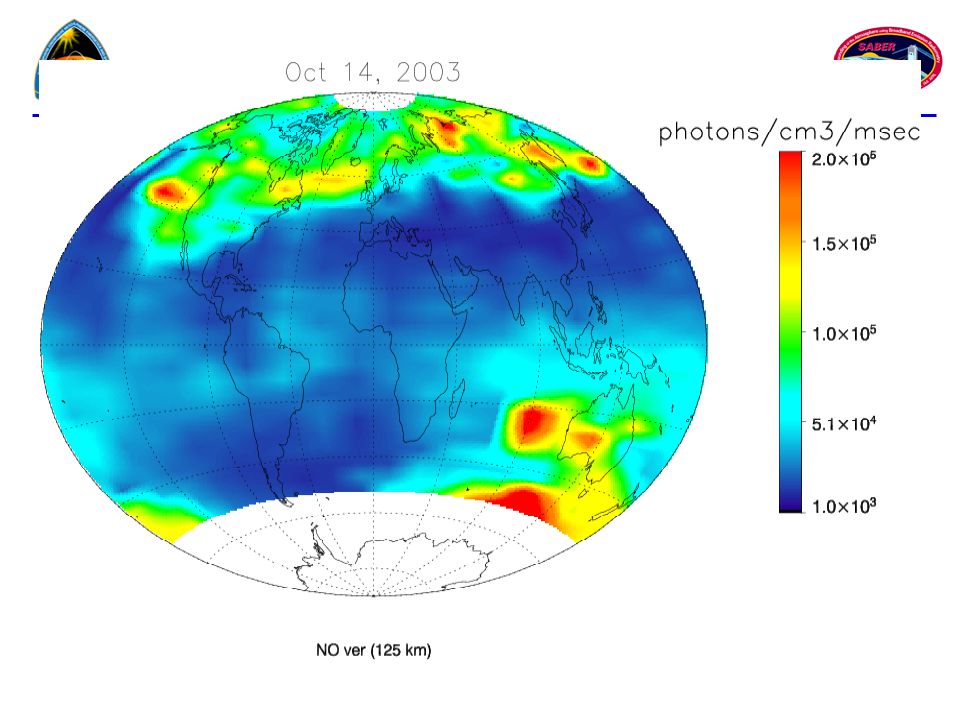
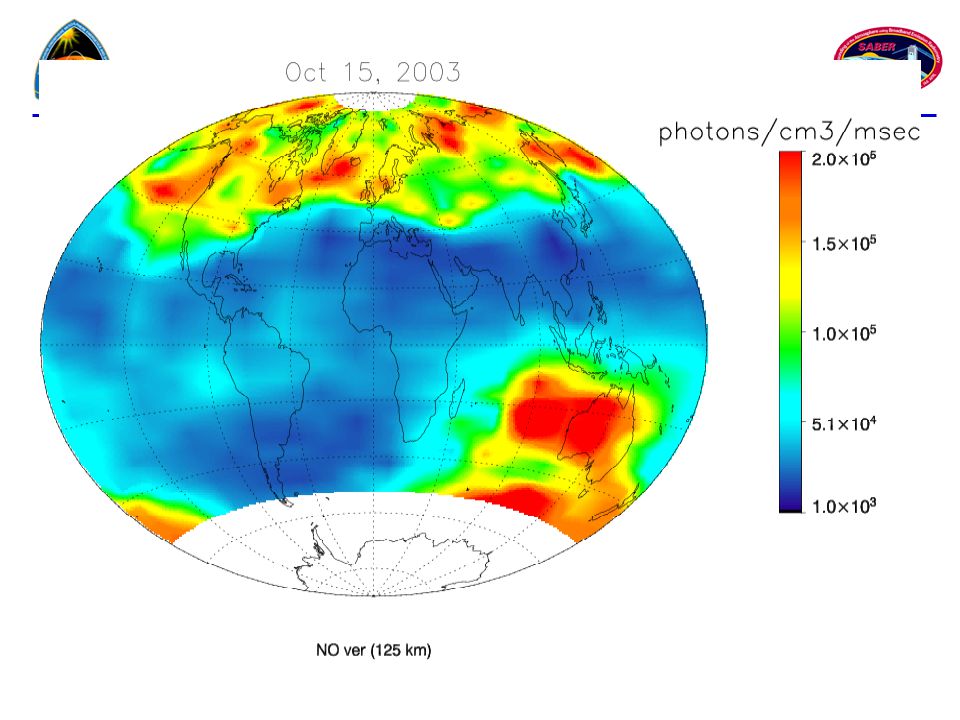
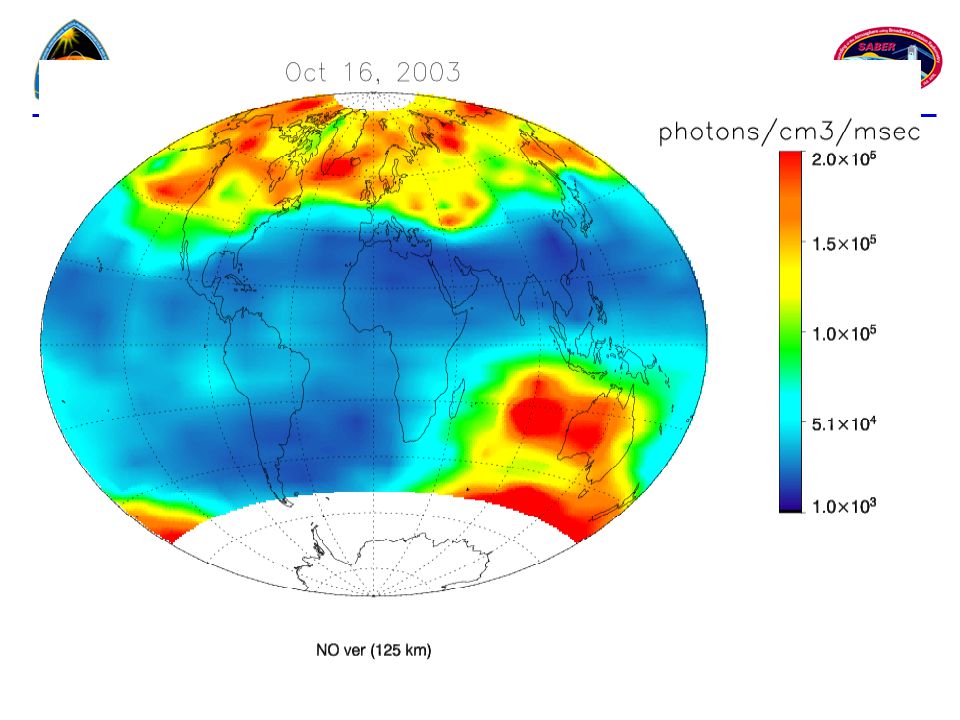
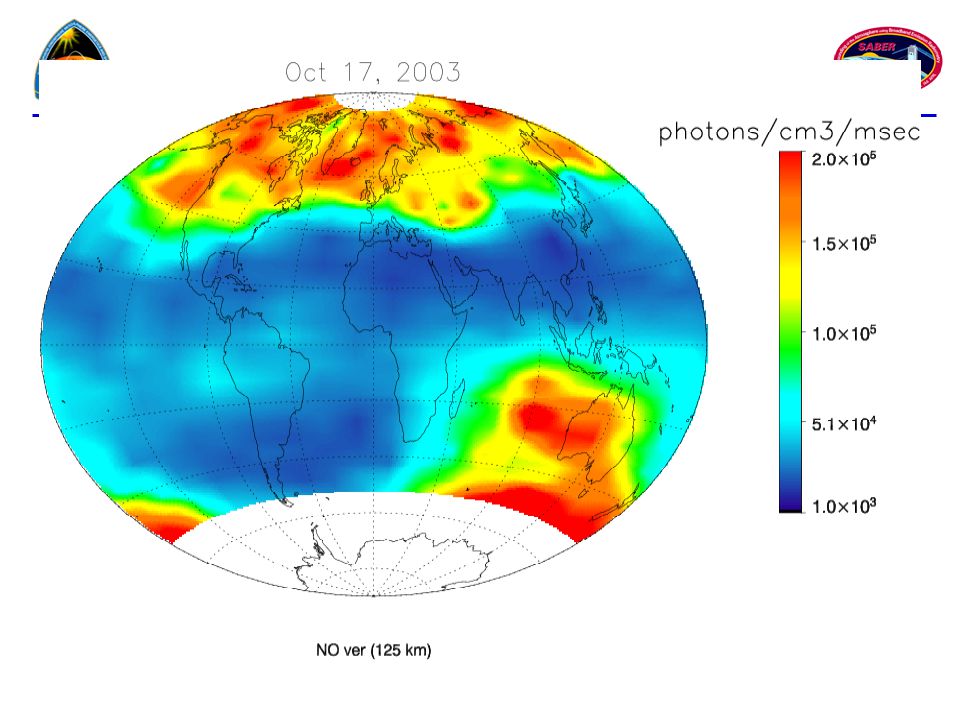
October – November 2003 Solar Storm

7
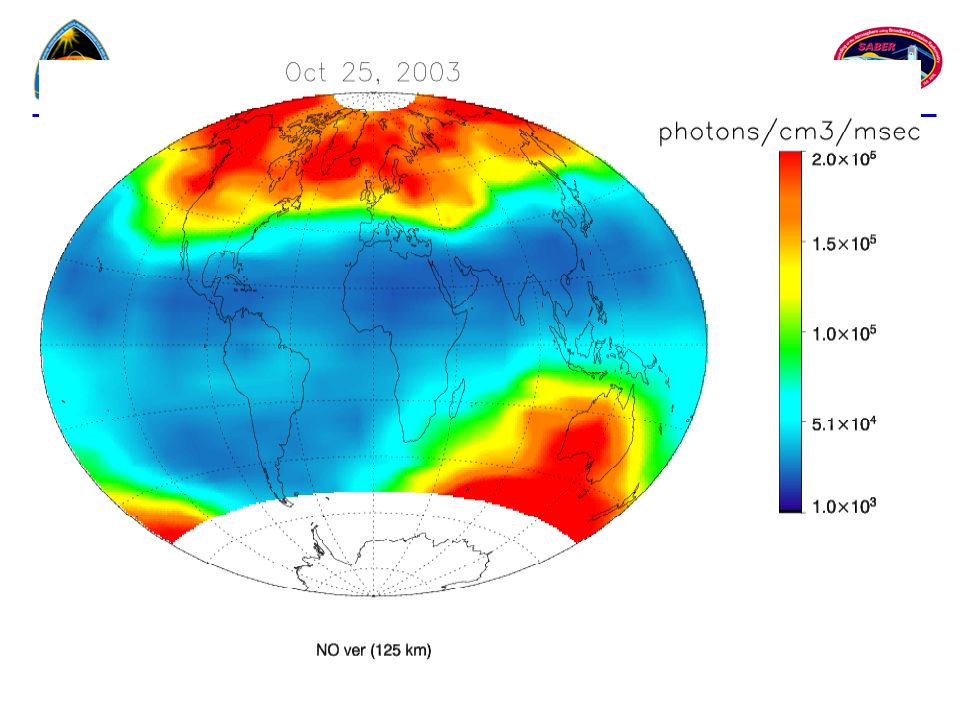
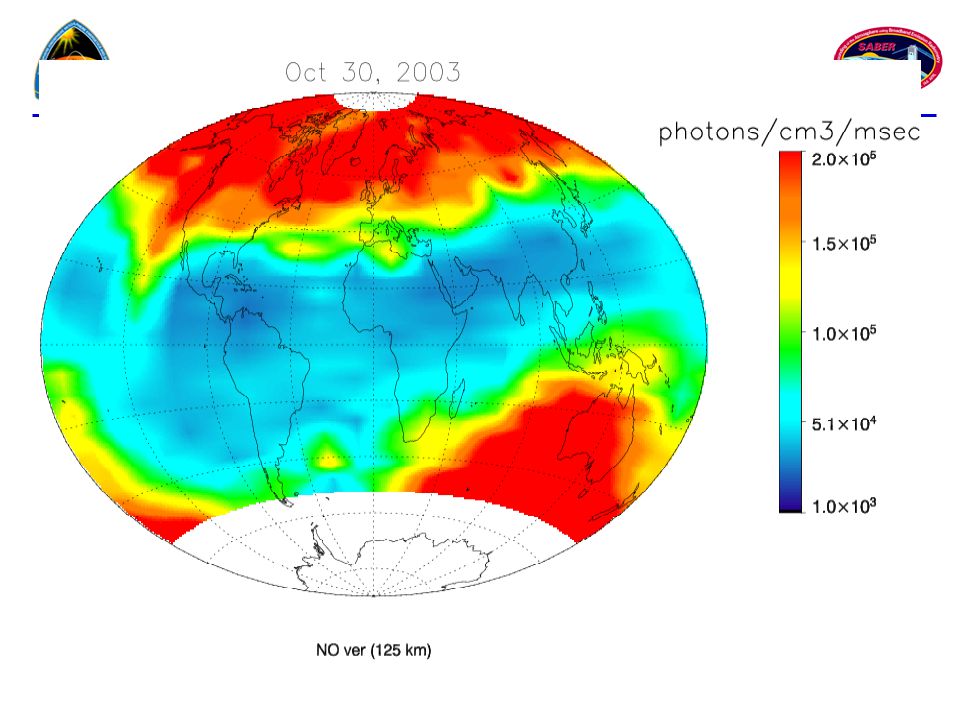
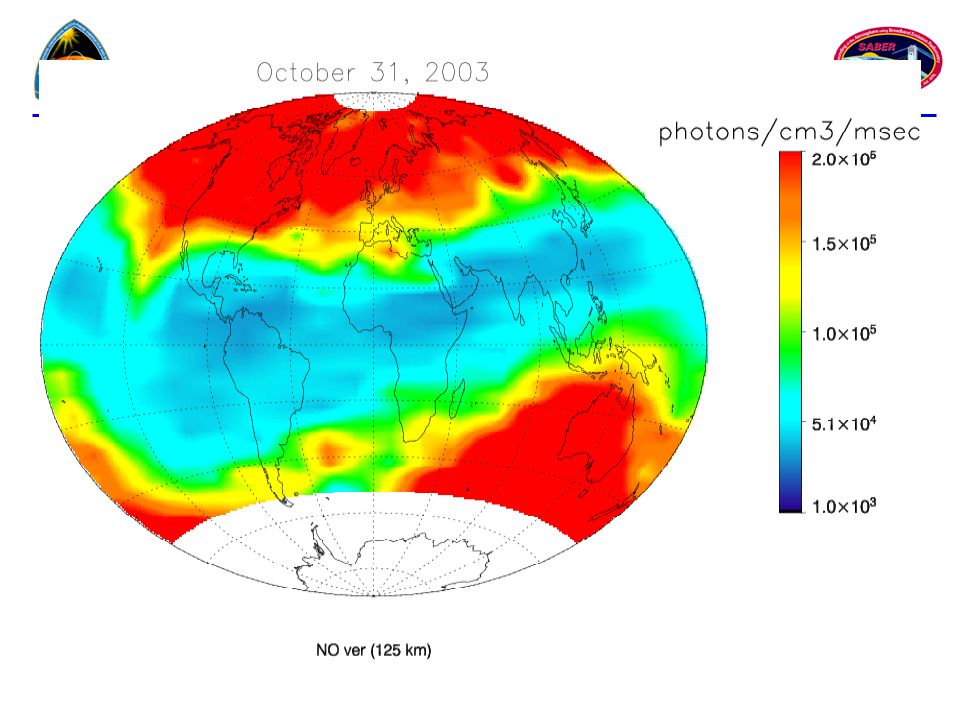
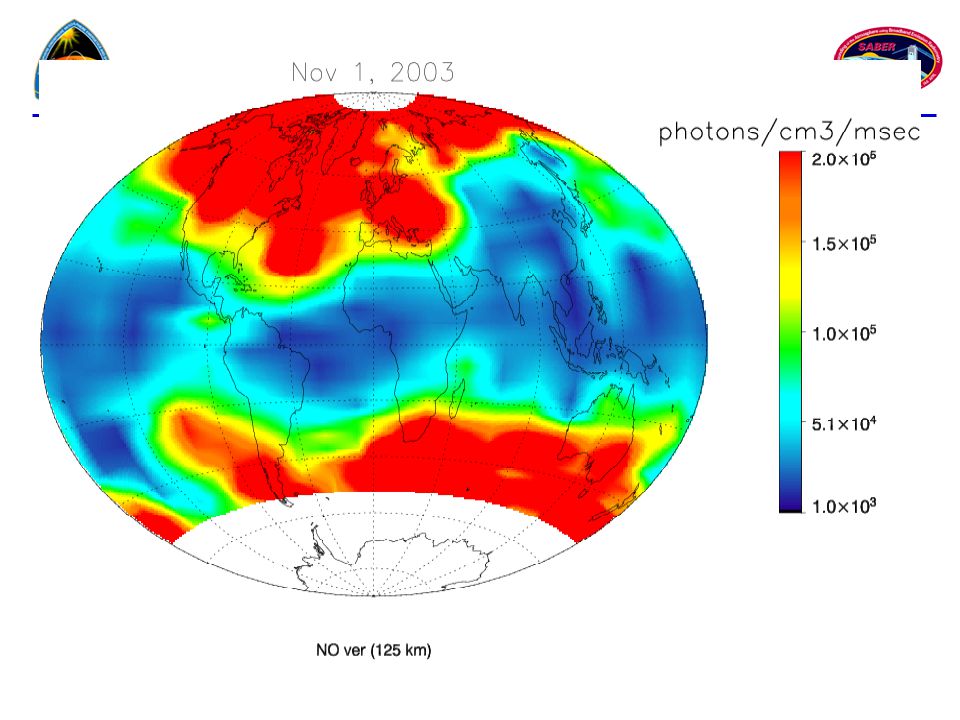
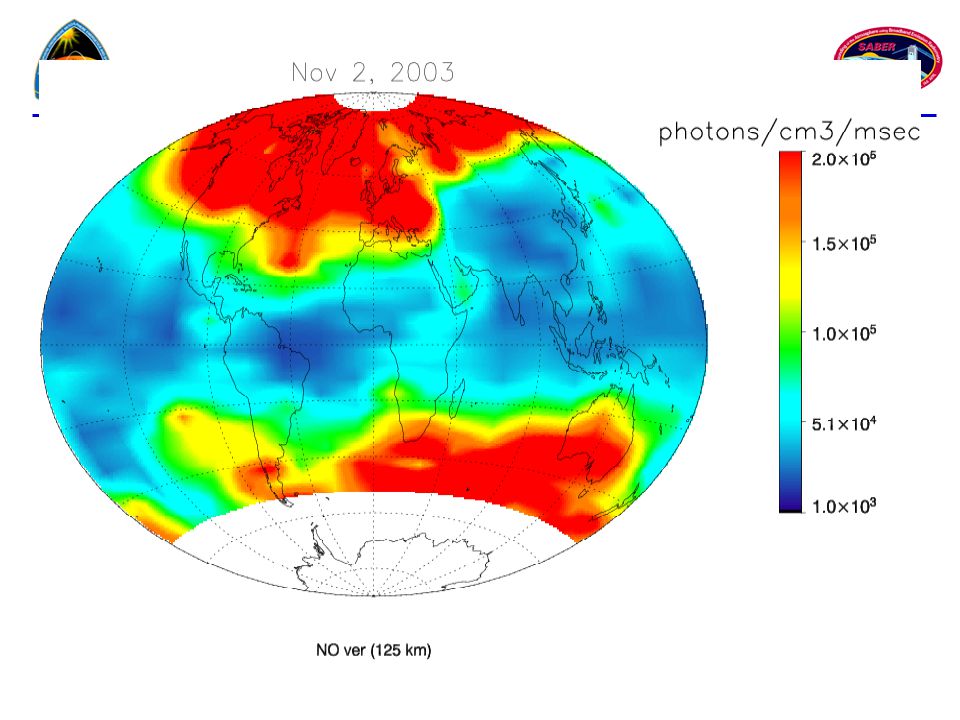
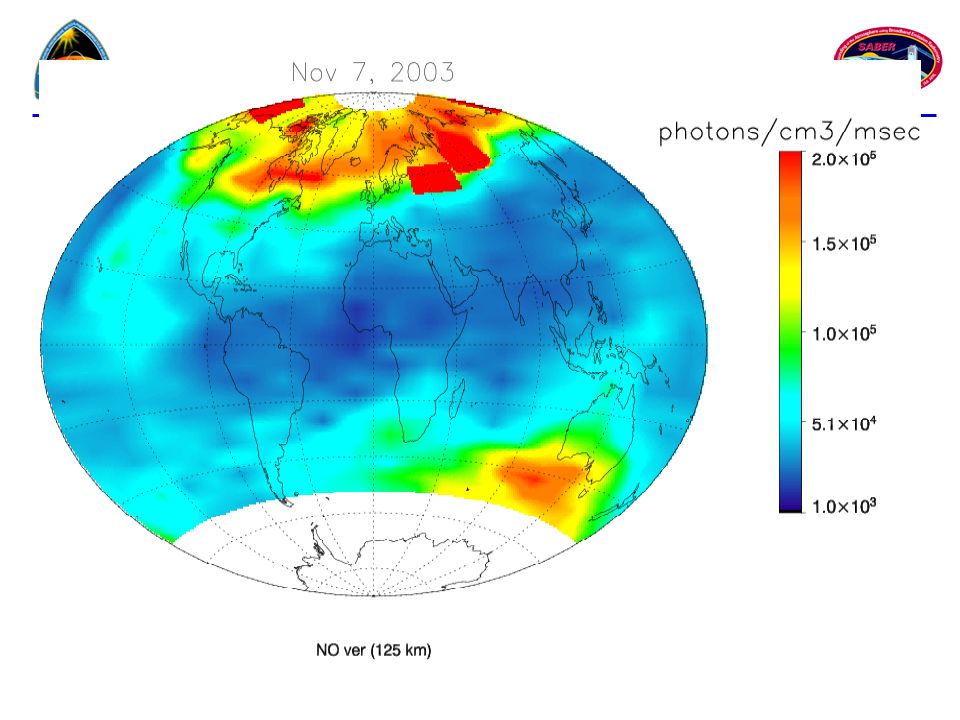
NO VER before storm October 12, 2003 NO VER near storm peak October 31, 2003 Oct – Nov, 2003 solar storm shows large effect on NO emission at 125 km

37
NO mixing ratio profiles measured by HALOE on the UARS Platform

38
HALOE daily zonal mean thermosphric NO profiles – Oct 2003

39
HALOE daily zonal mean thermosphric NO profiles – Nov 2003

40
NO VER time series at 125 km compared with X-ray, electron and proton fluxes from GOES and TIMED/SEE, Ap Index

41
SABER Avg NO VER 125 km 70 o N - 80 o N Daily averaged NO VERs at 125 km, 70 o N - 80 o N, and Ap index Ap Index Corr. Coeff. 73%

42
SABER 125 km northern hemisphere NO VERs on October 30 2003 with magnetic coordinates

43
NO VERs at 110 km prior to solar storms NO VERs at 110 km, April 18, 2002, near peak of solar storm SABER NO Volume Emission Rates during the April, 2002 and October, 2003 Solar Storms NO VERs at 110 km, October 31, 2003, near peak of solar storm

44
SH (45 o S – 84 o S) maximum NO radiance (in color, red high) and temperature (contours) altitude versus time SH NO radiance and Tk versus time (top) and 40km O 3 and NO polar plots (bottom) - June 1 to August 31, 2003 Ozone mixing ratio (left), NO radiance (left) and potential vorticity contours at 40 km on August 23, 2003 O3O3 NO O 3 loss coupled with implied NO descent
 maximum NO radiance (in color, red high) and temperature (contours) altitude versus time SH NO radiance and Tk versus time (top) and 40km O 3 and NO polar plots (bottom) - June 1 to August 31, 2003 Ozone mixing ratio (left), NO radiance (left) and potential vorticity contours at 40 km on August 23, 2003 O3O3 NO O 3 loss coupled with implied NO descent")
45
SABER 4.3- m Channel Solar Storm response compares well with GUVI LBH-2 SABER GUVI April 18, 2002

46
Comparison of SABER NO 5.3 m Energy Loss Rates for April, 2002 and October, 2003 solar storms October, 2003 82 o N April, 2002 82 o S Peak energy loss rates are comparable for the two storms

47
Energy loss rate comparison for SABER NO 5.3 m And calculated TIME-GCM/ASPEN [O] at 63 m NO is dominant ‘thermostat’ emitter in thermosphere storm NO [O] April, 2002 solar storm for 77.5 o S
![Energy loss rate comparison for SABER NO 5.3 m And calculated TIME-GCM/ASPEN [O] at 63 m NO is dominant ‘thermostat’ emitter in thermosphere storm NO [O] April, 2002 solar storm for 77.5 o S](http://images.slideplayer.com/10/2701743/slides/slide_47.jpg "Energy loss rate comparison for SABER NO 5.3 m And calculated TIME-GCM/ASPEN [O] at 63 m NO is dominant ‘thermostat’ emitter in thermosphere storm NO [O] April, 2002 solar storm for 77.5 o S")
48
SABER Temperature Tidal Structures

49
SABER CO 2 15- m Emission Shows Signature of Diurnal Tide Typical equatorial ascending / descending radiance profiles and difference (21 Mar 2002) Equatorial radiance ’s over 34 days (~8.8 hr LT ) - Vertical wavelength 22-25 km - Phase fronts descend with LT at ~ 22 km/day) - Consistent with interpretation as diurnal tide
 Equatorial radiance ’s over 34 days (~8.8 hr LT ) - Vertical wavelength km - Phase fronts descend with LT at ~ 22 km/day) - Consistent with interpretation as diurnal tide")
57
SABER Summary

58
SABER Performance Summary The SABER instrument performance in orbit is excellent Routine periodic turn - off needed to remove detector/filter focal plane ice but effect is small now. Of no consequence for data processing Field-of-View effects addressed using orbital data and FOV knowledge is well in-hand Temperature data quality is excellent and agrees well with correlative data NLTE temperature ZM cross section shows clear double mesopause structure Diurnal tide and “Quasi 2-day” wave signatures present Mesosphere chemical heating present on all days analyzed NO radiances show strong effects due to solar storms – large NO changes and major cooling Strong NO VER correlation with Ap index and enhancements align with magnetic coordinates. Evidence of NO descent to upper stratosphere with accompanying ozone loss.

Similar presentations


![INTROTHE MODELTHE DATATHE COMPARISONOUTLOOK 1 Atmospheric waves workshop 9-10 November, 2011 ESTEC, Noordwijk (NL)E 2011 Manuela Sornig [1] RIU – Department.](/9/2375544/big_thumb.jpg "INTROTHE MODELTHE DATATHE COMPARISONOUTLOOK 1 Atmospheric waves workshop 9-10 November, 2011 ESTEC, Noordwijk (NL)E 2011 Manuela Sornig [1] RIU – Department.>")
