Download presentation
Presentation is loading. Please wait.

1
Power Development Planning Governance and Climate Change The recent experiences of Thailand Suphakit Nuntavorakarn Healthy Public Policy Foundation, Thailand Presenting in “Generating Dialogue” discussion, 7 th December 2007 Grand Melia Hotel, Bali, Indonesia The Electricity Governance Initiative: The Second Assessment in Thailand

2
Power Development Planning in Thailand: PDP2007 by Ministry of Energy Demand forecast for the next 15 years Demand forecast for the next 15 years Fuel options Fuel options – Gas, coal, nuclear, renewables, etc. Least-cost planning Least-cost planning Public hearing Public hearing Decision-making Decision-making

3
Demand forecast: Less economic growth, but higher demand forecast ! Year Demand forecast April 2006 Demand forecast January 2007 GDP (%) MW Annual Growth GDP (%) MW Annual Growth MW%MW% 20065.021,9634.621,064-- 20075.523,4111,4486.594.822,5671,5037.14 2008- 2011 5.229,3371,4755.965.028,2141,4125.95 2012- 2016 5.538,2411,7815.445.637,6371,9036.00 2017- 2021 5.549,3552,2235.245.649,2132,3155.51
 MW Annual Growth GDP (%) MW Annual Growth MW%MW% , , ,4111, ,5671, ,3371, ,2141, ,2411, ,6371, ,3552, ,2132,")
4
Energy Options: The assumptions on fuel prices of PDP 2007 Notes : (1–3) PTT 31 Jan. 07 (55 USD/BBL) : ( 4) Electricity Generating Authority of Thailand : ( 5) Australian Bureau of Agri. and Res. Economics + Transportation cost 15 USD/Ton : (6) Ux Consulting Company January 2007 Gas: increase 3.6% in 15 year Lignite: Increase 47% Imported coal: Increase 4% Oil&Nuclear: Same price in the next 15 year
 : ( 4) Electricity Generating Authority of Thailand : ( 5) Australian Bureau of Agri. and Res. Economics + Transportation cost 15 USD/Ton : (6) Ux Consulting Company January 2007 Gas: increase 3.6% in 15 year Lignite: Increase 47% Imported coal: Increase 4% Oil&Nuclear: Same price in the next 15 year.")
5
Energy Options: Increase of the fuel cost The import price of energy (unit: 1000 Baht/Ton Oil Equi.) Fuel19992005 Increase (%) Increase (%) Crude oil 4.8515.61221.9 Natural gas 3.156.91119.6 Coal1.932.8447.2 Reference: Energy Report of Thailand, Dept. of Alt. Energy Dev. and Energy Conservation

6
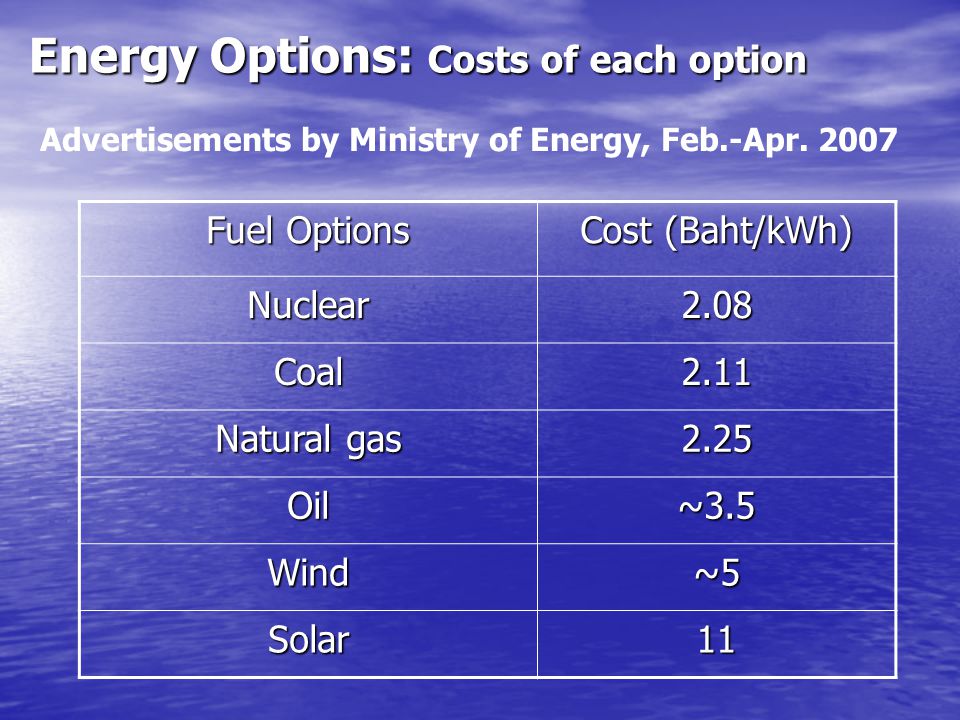
Energy Options: Costs of each option Fuel Options Cost (Baht/kWh) Nuclear2.08 Coal2.11 Natural gas 2.25 Oil~3.5 Wind~5 Solar11 Advertisements by Ministry of Energy, Feb.-Apr. 2007
7
Key Concerns on the nine PDP Options But why all renewables are fixed at only 1,700 MW in all options? But why all renewables are fixed at only 1,700 MW in all options? Why include nuclear of 4,000 MW in all options? Why include nuclear of 4,000 MW in all options? What are the impacts of each option? What are the impacts of each option? L = Low Growth B = Base Forecast H = High Growth 1=“Least-Cost” 2=“Feasible Coal Projects” 3=“LNG + More import”

8
The Public Hearings on PDP2007 The Ministry of Energy arranged the Public Hearing on 19 Feb. 2007 at a hotel in Bangkok The Ministry of Energy arranged the Public Hearing on 19 Feb. 2007 at a hotel in Bangkok The potentially-affected local people turned up of around 400 persons and the Minister cancel the Hearing The potentially-affected local people turned up of around 400 persons and the Minister cancel the Hearing MoE arranged another Public Hearing on 2 April 2007 in the Thai Army Club with armed soldiers ‘for security reason’! MoE arranged another Public Hearing on 2 April 2007 in the Thai Army Club with armed soldiers ‘for security reason’! NGOs, academics, and the local people boycotted the Hearing NGOs, academics, and the local people boycotted the Hearing

9
No Consideration on CO2 emission in PDP2007 Reference: Energy Report of Thailand, Dept. of Alt. Energy Dev. and Energy Conservation

10
หมายเหตุ 1. ใช้สมมติฐานว่าต้นทุนร้อยละ 12.4 ของค่าไฟฟ้ามาจากธุรกิจสายส่ง 2. ใช้สมมติฐานว่าต้นทุนร้อยละ 14.5 ของค่าไฟฟ้ามาจากธุรกิจจำหน่าย 3. ค่า CO2 ที่ 10 ยูโร/ตัน 4. ค่า Externality ตามการศึกษา Extern E ของสหภาพยุโรป และนำมาปรับลดตามค่า GDP ต่อหัวของไทย 5. การศึกษาของ World Bank 2005 6. ตามระเบียบ SPP 7. ที่มา : กฟผ. 8. Cost of liability protection, Journal “Regulation” 2002 – 2003 OptionsCost estimation (Baht per kWh) ผลิตส่ง 1 จำหน่าย 2 CO 2 3 ผลกระทบ สวล. อื่น ๆ 4 ผล กระทบ สังคม รวม DSM 0.50 – 1.50 5 -----0.50 - 1.50 Cogeneration (PES > 10%) 2.60 6 -0.440.080.71-3.83 VSPP (Renewable energies) ค่าไฟฟ้า ขายส่ง (~ 3) + Adder (0.3 – 8) -0.44-0 – 0.63 0 – ต่ำ 3.3 – 11.0 CCGT 2.25 7 0.370.440.090.79 ต่ำ – ปานกลาง 3.93 Coal 2.11 7 0.370.440.152.76 สูง 5.82 Nuclear 2.08 7 0.370.44-0.15 + 1.00 8 สูง - สูงมาก 4.04 No consideration of externalities and total cost
 ผลิตส่ง 1 จำหน่าย 2 CO 2 3 ผลกระทบ สวล. อื่น ๆ 4 ผล กระทบ สังคม รวม DSM 0.50 – Cogeneration (PES > 10%) VSPP (Renewable energies) ค่าไฟฟ้า ขายส่ง (~ 3) + Adder (0.3 – 8) – – ต่ำ 3.3 – 11.0 CCGT ต่ำ – ปานกลาง 3.93 Coal สูง 5.82 Nuclear สูง - สูงมาก 4.04 No consideration of externalities and total cost.")
11
Who gains from the existing planning process : The growth of energy companies in Thai Stock Market 20022003200420052006 No. of listed companies 912151620 Total sale (Million Baht) 537,106 674,8931,061,7511,500,5942,250,161 Profit (Million Baht) 46,81864,893113,884149,832176,126 Prelim. Profit (%) 19.017.716.516.313.9 Reference: Thai Stock Market, Key Annual Data
 537, ,8931,061,7511,500,5942,250,161 Profit (Million Baht) 46,81864,893113,884149,832176,126 Prelim. Profit (%) Reference: Thai Stock Market, Key Annual Data.")
12
Who loss from the existing planning process: Energy expenses of Thai households 1990-2006 Reference: National Statistic Office

13
Alternative Power Development Planning The alternative PDP ‘20:20 by 2020’ The alternative PDP ‘20:20 by 2020’ Reform of the Power Development Planning to promote good governance Reform of the Power Development Planning to promote good governance

14
Source: Decharut Sukkumnoed, 2007 Alternative Power Development Plan and its impact assessment

15
Environmental impacts: CO2 emission Source: Decharut Sukkumnoed, 2007

16
Health impact: Chronic mortality from air pollution Source: Decharut Sukkumnoed, 2007

17
Economic impact: Externality costs Source: Decharut Sukkumnoed, 2007

18
Economic impact: Total costs Source: Decharut Sukkumnoed, 2007

19
Alternative Future of Thai Power Sector ‘20:20 by 2020’ DSM to decrease the forecasted peak demand 20 percent within 2020 DSM to decrease the forecasted peak demand 20 percent within 2020 Develop decentralized power generation to be 20 percent of total generation by 2020 and must be achieved by Develop decentralized power generation to be 20 percent of total generation by 2020 and must be achieved by – Renewable energy, more than 60 percent – Community-based power generation, more than 20 percent

20
‘20:20 by 2020’ Possible? DSM to reduce 6,992 MW within 2020 DSM to reduce 6,992 MW within 2020 – The present potential 2,500 MW within 2011 Develop decentralized power generation 6,400 MW by 2020 Develop decentralized power generation 6,400 MW by 2020 – The commercially-feasible Cogeneration 3,000 MW – Renewable energy 3,840 MW, the recent proposals 3,000 MW – Community-based power generation 1,280 MW (Come and hear by yourselves)
.")
21
Alternative Future of Thai Power Sector ‘20:20 by 2020’ Compare to PDP2007… Compare to PDP2007… Save the investment of seven billion USD for 4,000 MW Nuclear Power Plants Save the investment of seven billion USD for 4,000 MW Nuclear Power Plants Save the investment of 4.5 billion USD for 2,800 MW Coal Power Plants Save the investment of 4.5 billion USD for 2,800 MW Coal Power Plants Save the investment of 5.4 billion USD for 9,800 MW Gas Power Plants Save the investment of 5.4 billion USD for 9,800 MW Gas Power Plants Save the fuels import of 2.3 billion USD in 2020 Save the fuels import of 2.3 billion USD in 2020 Reduce CO2 emission 50 million tons Reduce CO2 emission 50 million tons

22
Integrated planning framework proposed to government and society

Similar presentations


 Toyo Engineering Co. (TOYO)>")


