Download presentation
Presentation is loading. Please wait.

1
Bill Daggett, Founder and Chairman
Common Core State Standards Next Generation Assessments The Why and What Bill Daggett, Founder and Chairman November 16, 2012

2
Growing Gap Changing World School Improvement Readiness

3
Growing Gap Changing World School Improvement

4
Growing Gap Changing World School Improvement

5
Growing Gap School Improvement Changing World

6
Common Core State Standards

7
23 Successful Practices WHAT

8
College and Career Ready
Fewer Clearer Higher

9
Interquartile Ranges Shown (25% - 75%)
Reading Study Summary Interquartile Ranges Shown (25% - 75%) 1600 1400 1200 Text Lexile Measure (L) 1000 800 600 High School Literature College Literature High School Textbooks College Textbooks Military Personal Use Entry-Level Occupations SAT 1, ACT, AP* * Source of National Test Data: MetaMetrics
 Text Lexile Measure (L) High. School. Literature. College. Literature. High. School. Textbooks. College. Textbooks. Military. Personal. Use. Entry-Level. Occupations. SAT 1, ACT, AP* * Source of National Test Data: MetaMetrics.")
10
College and Career Ready
Fewer Clearer Higher Different

11
Application Model Knowledge in one discipline
Application within discipline Application across disciplines Application to real-world predictable situations Application to real-world unpredictable situations

12
Application Model Knowledge in one discipline
Application within discipline Application across disciplines Application to real-world predictable situations Application to real-world unpredictable situations

13
Knowledge Taxonomy Awareness Comprehension Application Analysis
Synthesis Evaluation

14
Levels Bloom’s C D A B 4 5 6 3 2 1 Application

15
D C B A Rigor/Relevance Framework 6 5 4 3 2 1 1 2 3 4 5
Analyze the graphs of the perimeters and areas of squares having different-length sides. Determine the largest rectangular area for a fixed perimeter. Identify coordinates for ordered pairs that satisfy an algebraic relation or function. Determine and justify the similarity or congruence for two geometric shapes. Obtain historical data about local weather to predict the chance of snow, rain, or sun during year. Test consumer products and illustrate the data graphically. Plan a large school event and calculate resources (food, decorations, etc.) you need to organize and hold this event. Make a scale drawing of the classroom on grid paper, each group using a different scale. D C 5 4 3 Calculate percentages of advertising in a newspaper. Tour the school building and identify examples of parallel and perpendicular lines, planes, and angles. Determine the median and mode of real data displayed in a histogram Organize and display collected data, using appropriate tables, charts, or graphs. Express probabilities as fractions, percents, or decimals. Classify triangles according to angle size and/or length of sides. Calculate volume of simple three- dimensional shapes. Given the coordinates of a quadrilateral, plot the quadrilateral on a grid. 2 A B 1 1 2 3 4 5
 you need to organize and hold this event. Make a scale drawing of the classroom on grid paper, each group using a different scale. D. C Calculate percentages of advertising in a newspaper. Tour the school building and identify examples of parallel and perpendicular lines, planes, and angles. Determine the median and mode of real data displayed in a histogram. Organize and display collected data, using appropriate tables, charts, or graphs. Express probabilities as fractions, percents, or decimals. Classify triangles according to angle size and/or length of sides. Calculate volume of simple three- dimensional shapes. Given the coordinates of a quadrilateral, plot the quadrilateral on a grid. 2. A. B")
16
D C B A Rigor/Relevance Framework 6 5 4 3 2 1 1 2 3 4 5
Analyze the graphs of the perimeters and areas of squares having different-length sides. Determine the largest rectangular area for a fixed perimeter. Identify coordinates for ordered pairs that satisfy an algebraic relation or function. Determine and justify the similarity or congruence for two geometric shapes. Obtain historical data about local weather to predict the chance of snow, rain, or sun during year. Test consumer products and illustrate the data graphically. Plan a large school event and calculate resources (food, decorations, etc.) you need to organize and hold this event. Make a scale drawing of the classroom on grid paper, each group using a different scale. D Express probabilities as fractions, percents, or decimals. Classify triangles according to angle size and/or length of sides. Calculate volume of simple three- dimensional shapes. Given the coordinates of a quadrilateral, plot the quadrilateral on a grid. C 5 4 3 Calculate percentages of advertising in a newspaper. Tour the school building and identify examples of parallel and perpendicular lines, planes, and angles. Determine the median and mode of real data displayed in a histogram Organize and display collected data, using appropriate tables, charts, or graphs. 2 A B 1 1 2 3 4 5
 you need to organize and hold this event. Make a scale drawing of the classroom on grid paper, each group using a different scale. D. Express probabilities as fractions, percents, or decimals. Classify triangles according to angle size and/or length of sides. Calculate volume of simple three- dimensional shapes. Given the coordinates of a quadrilateral, plot the quadrilateral on a grid. C Calculate percentages of advertising in a newspaper. Tour the school building and identify examples of parallel and perpendicular lines, planes, and angles. Determine the median and mode of real data displayed in a histogram. Organize and display collected data, using appropriate tables, charts, or graphs. 2. A. B")
17
D C B A Rigor/Relevance Framework 6 5 4 3 2 1 1 2 3 4 5
Analyze the graphs of the perimeters and areas of squares having different-length sides. Determine the largest rectangular area for a fixed perimeter. Identify coordinates for ordered pairs that satisfy an algebraic relation or function. Determine and justify the similarity or congruence for two geometric shapes. Calculate percentages of advertising in a newspaper. Tour the school building and identify examples of parallel and perpendicular lines, planes, and angles. Determine the median and mode of real data displayed in a histogram. Organize and display collected data, using appropriate tables, charts, or graphs. Obtain historical data about local weather to predict the chance of snow, rain, or sun during year. Test consumer products and illustrate the data graphically. Plan a large school event and calculate resources (food, decorations, etc.) you need to organize and hold this event. Make a scale drawing of the classroom on grid paper, each group using a different scale. D C 5 4 3 Express probabilities as fractions, percents, or decimals. Classify triangles according to angle size and/or length of sides. Calculate volume of simple three- dimensional shapes. Given the coordinates of a quadrilateral, plot the quadrilateral on a grid. 2 A B 1 1 2 3 4 5
 you need to organize and hold this event. Make a scale drawing of the classroom on grid paper, each group using a different scale. D. C Express probabilities as fractions, percents, or decimals. Classify triangles according to angle size and/or length of sides. Calculate volume of simple three- dimensional shapes. Given the coordinates of a quadrilateral, plot the quadrilateral on a grid. 2. A. B")
18
Levels Bloom’s C D A B 4 5 6 3 2 1 Application

19
2 Second Rule The “two-second rule” is used by a driver who wants to maintain a safe following distance at any speed. A driver must count two seconds from when the car in front of him or her passes a fixed point, such as a tree, until the driver passes the same fixed point. Drivers use this rule to determine the minimum distance to follow a car traveling at the same speed. A diagram representing this distance is shown. As the speed of the cars increases, the minimum following distance also increases. Explain how the “two-second rule” leads to a greater minimum following distance as the speed of the cars increases. As part of your explanation, include the minimum following distances, in feet, for cars traveling at 30 miles per hour and 60 miles per hour.

20
Rigor/Relevance Framework
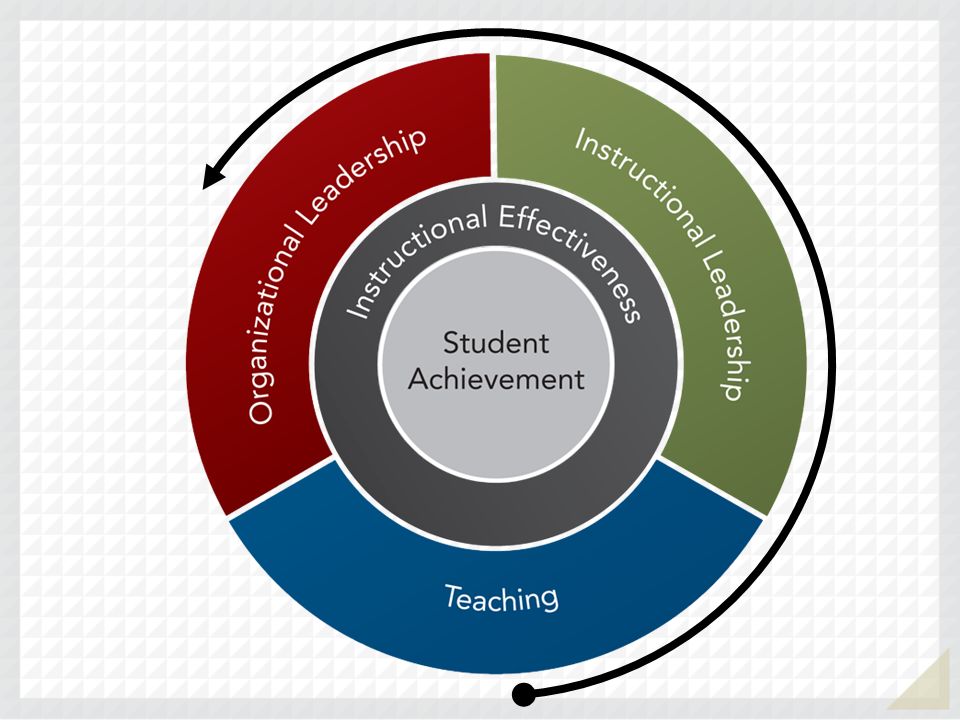
Another way to think about the quadrants is who is doing the thinking and the work. When students are working and thinking, they are engaging in high rigor/high relevant activities. Aside to consultant: you may want to gauge the room to see how many people have heard of the Framework before, how many know it well, and how many know it very well. This session is not an overview of the Framework, if they would like more information, point them to Linda Jordan’s sessions in the program.

21
Quad D – Skills and Knowledge
Decision Making Innovation/Creativity Goal Setting/Results Driven Multi Tasking Work with others

22
Growing Gap School Improvement Changing World

23
21st Annual Model Schools Conference
Effective and efficient practices for improving student achievement in times of decreasing resources and increasing expectations Focusing on instructional excellence as the key to the Common Core State Standards, Next Generation Assessments, and Teacher Evaluations Providing effective instructional approaches for special populations June 30 – July 3 | Washington, D.C.

24
23 Successful Practices WHY

25
The Changing Landscape
Technology

26
Semantic Web Analyze Documents Keywords and Headers (Google)
Meaning / Concepts Wolfram Alpha Complete Task

27
internet users in europe Weather Springfield
what is the gdp of france / italy what is the gdp of france? gdp france Integrate x^2 sin^3 x dx springfield 2 + 2

28
Implications Homework

29
Implications Homework Term Paper

32
SPOT Integrated Projection Projection Keyboard

33
Projection Keyboard

34
Projection Keyboard and Monitor

35
Project Glass Technology should work for you—to be there when you need it and get out of your way when you don’t. Google X started Project Glass to build this kind of technology, one that helps you explore and share your world, putting you back in the moment. 35

36
Download any movie, website, or piece of information into your glasses or contact lenses

37
Today’s students live in a hyper-connected world, except in school OR
are they also connected in school but we just don’t know it?

38
Information is everywhere
Information is everywhere. In this changing world, sense-making and the ability to evaluate the credibility of information are paramount.

39
The Changing Landscape
Technology Financial

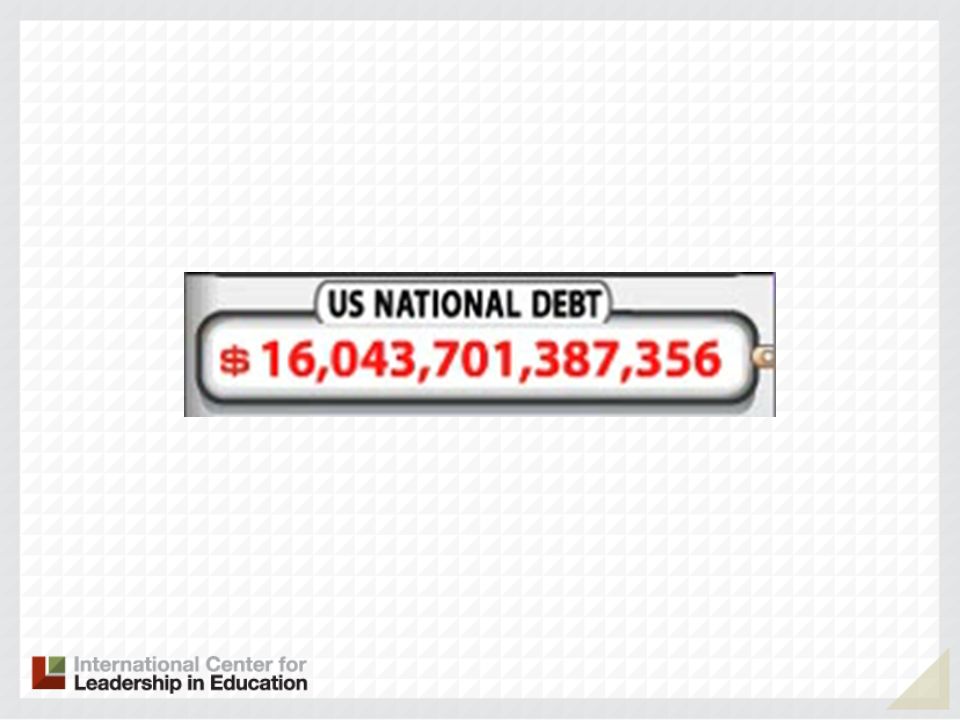
43
2011 US Federal Budget -borrowing 41% of every dollar it is spending

44
Federal Obligations $534,000 per household More than 5 times Mortgages
Car Loans College Loans Credit Cards

45
The Changing Landscape
Technology Financial Globalization

46
PISA 2009 Overall Reading Scale 1 Shanghai-China 556 2 Korea 539 3
Finland 536 4 Hong Kong-China 533 5 Singapore 526 6 Canada 524 7 New Zealand 521 8 Japan 520 9 Australia 515 10 Netherlands 508 17 United States 500 20 Germany 497 21 Ireland 496 22 France 25 United Kingdom 494 33 Spain 481 43 Russian Federation 459 48 Mexico 425 53 Brazil 412 57 Indonesia 402 PISA 2009 Overall Reading Scale Significantly Above OECD Average Not Significantly Different (OECD Average 493) Significantly below OECD Average 46
 Significantly below OECD Average. 46.")
47
PISA 2009 Overall Math Scale 25th last time 1 Shanghai-China 600 2
Singapore 562 3 Hong Kong-China 555 4 Korea 546 6 Finland 541 9 Japan 529 10 Canada 527 11 Netherlands 526 13 New Zealand 519 15 Australia 514 16 Germany 513 22 France 497 28 United Kingdom 492 31 United States 487 32 Ireland 34 Spain 483 38 Russian Federation 468 51 Mexico 419 57 Brazil 386 61 Indonesia 371 PISA 2009 Overall Math Scale Significantly Above OECD Average Not Significantly Different (OECD Average 496) Significantly below OECD Average 25th last time 47
 Significantly below OECD Average. 25th last time. 47.")
48
PISA 2009 Overall Science Scale Last time 21 1 Shanghai-China 575 2
Finland 554 3 Hong Kong-China 549 4 Singapore 542 5 Japan 539 6 Korea 538 7 New Zealand 532 8 Canada 529 10 Australia 527 11 Netherlands 522 13 Germany 520 16 United Kingdom 514 20 Ireland 508 23 United States 502 27 France 498 36 Spain 488 39 Russian Federation 478 50 Mexico 416 53 Brazil 405 60 Indonesia 383 PISA 2009 Overall Science Scale Significantly Above OECD Average Not Significantly Different (OECD Average 501) Significantly below OECD Average Last time 21 48
 Significantly below OECD Average. Last time")
49
The Changing Landscape
Technology Financial Globalization Demographics

50
Population 1950 2010 2050 Male Female

51
Growing Gap School Improvement Changing World

52
23 Successful Practices WHAT

53
Next Generation Assessments

54
2 Second Rule The “two-second rule” is used by a driver who wants to maintain a safe following distance at any speed. A driver must count two seconds from when the car in front of him or her passes a fixed point, such as a tree, until the driver passes the same fixed point. Drivers use this rule to determine the minimum distance to follow a car traveling at the same speed. A diagram representing this distance is shown. As the speed of the cars increases, the minimum following distance also increases. Explain how the “two-second rule” leads to a greater minimum following distance as the speed of the cars increases. As part of your explanation, include the minimum following distances, in feet, for cars traveling at 30 miles per hour and 60 miles per hour.

55
Growing Gap School Improvement Changing World

56
23 Successful Practices HOW did they do it?

57
No Formula

63
21st Annual Model Schools Conference
Effective and efficient practices for improving student achievement in times of decreasing resources and increasing expectations Focusing on instructional excellence as the key to the Common Core State Standards, Next Generation Assessments, and Teacher Evaluations Providing effective instructional approaches for special populations June 30 – July 3 | Washington, D.C.

64
International Center for Leadership in Education
1587 Route 146 Rexford, NY Phone (518) Fax (518)
 Fax (518)")
65
Common Core State Standards Next Generation Assessments The How
Bill Daggett, Founder and Chairman November 16, 2012

66
Growing Gap Changing World School Improvement

67
Growing Gap Changing World School Improvement

68
Growing Gap School Improvement Changing World

69
No Formula

70
SUCCESS BY DESIGN NOT BY CHANCE

76
21st Annual Model Schools Conference
Effective and efficient practices for improving student achievement in times of decreasing resources and increasing expectations Focusing on instructional excellence as the key to the Common Core State Standards, Next Generation Assessments, and Teacher Evaluations Providing effective instructional approaches for special populations June 30 – July 3 | Washington, D.C.

77
Organizational Leadership
Culture Culture

78
The Changing Landscape
Technology Financial Globalization Demographics

79
Organizational Leadership
Vision Vision Culture

80
College and Career Ready
Fewer Clearer Higher

81
Academics

82
Layers of non-sequential but increasingly complex knowledge

83
College Ready 4 5 6 3 2 1

84
Academics

85
K-12 Culture Rules

86
K-12 Culture Rules Regulation

87
K-12 Culture Rules Regulation Certification

88
K-12 Culture Rules Regulation Certification Tenure

89
K-12 Culture Rules Regulation Certification Tenure Contracts

90
K-12 Culture Rules Regulation Certification Tenure Contracts
Teachers Trained

91
K-12 Culture Rules Regulation Certification Tenure Contracts
Teachers Trained Physical Plant

92
Career Ready

93
Career Ready Knowledge in one discipline Application within discipline
Application across disciplines Application to real-world predictable situations Application to real-world unpredictable situations

94
College and Career Ready
Fewer Clearer Higher Different

95
Career Ready

96
College Ready

97
Interquartile Ranges Shown (25% - 75%)
Reading Study Summary Interquartile Ranges Shown (25% - 75%) 1600 1400 1200 Text Lexile Measure (L) 1000 800 600 High School Literature College Literature High School Textbooks College Textbooks Military Personal Use Entry-Level Occupations SAT 1, ACT, AP* * Source of National Test Data: MetaMetrics
 Text Lexile Measure (L) High. School. Literature. College. Literature. High. School. Textbooks. College. Textbooks. Military. Personal. Use. Entry-Level. Occupations. SAT 1, ACT, AP* * Source of National Test Data: MetaMetrics.")
98
Career Ready

99
Career Ready

100
Requires Both Vertical and Horizontal Integration
Career Ready Requires Both Vertical and Horizontal Integration

101
Career Ready

102
Levels Bloom’s C D A B 4 5 6 3 2 1 Application

103
College Ready D C A B

104
Career Ready D C A B

105
Organizational Leadership
Structure and Systems Structure and systems Vision Culture

106
Organizational Changes
Looping

107
Organizational Changes
Looping Interdisciplinary Chairs

108
Organizational Changes
Looping Interdisciplinary Chairs 9th Grade Electives

109
Organizational Leadership
Build Leadership Structure and systems Build leadership Vision Culture

110
Top-down support for bottom-up success

111
Empower Leadership Teams

112
Organizational Leadership Selection, Support, Evaluation
Structure and systems Build leadership Selection, support, evaluation Vision Culture

113
Organizational Leadership Selection, Support, Evaluation
Structure and systems Build leadership Selection, support, evaluation Vision Culture

114
Organizational Leadership
Data Systems Structure and systems Build leadership Selection, support, evaluation Vision Data systems Culture

116
Instructional Leadership
High Expectations High expectations

117
Interquartile Ranges Shown (25% - 75%)
Reading Study Summary Interquartile Ranges Shown (25% - 75%) 1600 1400 1200 Text Lexile Measure (L) 1000 800 600 High School Literature College Literature High School Textbooks College Textbooks Military Personal Use Entry-Level Occupations SAT 1, ACT, AP* * Source of National Test Data: MetaMetrics
 Text Lexile Measure (L) High. School. Literature. College. Literature. High. School. Textbooks. College. Textbooks. Military. Personal. Use. Entry-Level. Occupations. SAT 1, ACT, AP* * Source of National Test Data: MetaMetrics.")
118
2005 Proficiency Grade 4 Reading
Proficient Required NAEP Score Mississippi 88 % Georgia 87 % Wisconsin 83 % Texas 81 % Ohio 77 % Florida 71% Arkansas 53 % Massachusetts 48 %

119
2005 Proficiency Grade 4 Reading
Proficient Required NAEP Score Mississippi 88 % 161 Georgia 87 % 175 Wisconsin 83 % 189 Texas 81 % 190 Ohio 77 % 199 Florida 71% 202 Arkansas 53 % 217 Massachusetts 48 % 234

120
2009 Proficiency Grade 4 Reading
Proficient Required NAEP Score Georgia 87 % Texas 84 % Ohio 82 % Wisconsin Florida 74% Arkansas 70 % Massachusetts 54 % Mississippi 52 %

121
2009 Proficiency Grade 4 Reading
Proficient Required NAEP Score Georgia 87 % 178 Texas 84 % 188 Ohio 82 % 192 Wisconsin 189 Florida 74% 206 Arkansas 70 % 200 Massachusetts 54 % 234 Mississippi 52 % 210

122
2009 Proficiency Grade 4 Reading
Proficient Required NAEP Score Georgia 87 % (0) 178 (+3) Texas 84 % (+3) 188 (-2) Ohio 82 % (+5) 192 (-7) Wisconsin 82 % (-1) 189 (0) Florida 74% (+3) 206 (+4) Arkansas 70 % (+17) 200 (-17) Massachusetts 54 % (+6) 234 (0) Mississippi 52 % (-36) 210 (+49)
 178 (+3) Texas. 84 % (+3) 188 (-2) Ohio. 82 % (+5) 192 (-7) Wisconsin. 82 % (-1) 189 (0) Florida. 74% (+3) 206 (+4) Arkansas. 70 % (+17) 200 (-17) Massachusetts. 54 % (+6) 234 (0) Mississippi. 52 % (-36) 210 (+49)")
123
2009 Proficiency Grade 8 Reading
Proficient Required NAEP Score Texas 94 % (+11) 201 (-24) Wisconsin 85 % (-1) 232 (+3) Georgia 77 % (-6) 209 (-15) Ohio 72 % (-8) 251 (+10) Arkansas 71 % (+14) 241 (-13) Florida 54 % (+10) 262 (-3) Mississippi 48 % (-10) 254 (+7) California 48 % (+9) 259 (-3)
 201 (-24) Wisconsin. 85 % (-1) 232 (+3) Georgia. 77 % (-6) 209 (-15) Ohio. 72 % (-8) 251 (+10) Arkansas. 71 % (+14) 241 (-13) Florida. 54 % (+10) 262 (-3) Mississippi. 48 % (-10) 254 (+7) California. 48 % (+9) 259 (-3)")
124
2009 Proficiency Grade 4 Mathematics
Proficient Required NAEP Score Texas 85 % (+3) 214 (-5) Wisconsin 81 % (+7) 219 (+4) Mississippi 58 % (-21) 223 (+17) Georgia 75 % (0) 218 (+3) Ohio 78 % (+13) 219 (-14) Florida 75 % (+12) 225 (-5) Arkansas 78 % (+25) 216 (-20) Massachusetts 48 % (+9) 255 (0)
 214 (-5) Wisconsin. 81 % (+7) 219 (+4) Mississippi. 58 % (-21) 223 (+17) Georgia. 75 % (0) 218 (+3) Ohio. 78 % (+13) 219 (-14) Florida. 75 % (+12) 225 (-5) Arkansas. 78 % (+25) 216 (-20) Massachusetts. 48 % (+9) 255 (0)")
125
2009 Proficiency Grade 8 Mathematics
Proficient Required NAEP Score Texas 83 % (+22) 254 (-19) Illinois 82 % (+28) 251 (-25) New York 80 % (+24) 249 (-26) Ohio 71 % (+8) 265 (-9) Oklahoma 59 % (-8) 269 (+11) Mississippi 54 % (+1) 264 (+2) Massachusetts 49 % (+7) 300 (-1) Missouri 47 % (+3) 287 (-2)
 254 (-19) Illinois. 82 % (+28) 251 (-25) New York. 80 % (+24) 249 (-26) Ohio. 71 % (+8) 265 (-9) Oklahoma. 59 % (-8) 269 (+11) Mississippi. 54 % (+1) 264 (+2) Massachusetts. 49 % (+7) 300 (-1) Missouri. 47 % (+3) 287 (-2)")
126
Instructional Leadership
Curriculum Curriculum High expectations

127
Instructional Leadership
Literacy and Math Literacy and math Curriculum High expectations

128
Instructional Leadership
Data-driven Literacy and math Data-driven Curriculum High expectations

129
Take off the plate

130
Next Network

131
1 2 3 4 5

132
Road Map State Standards to State Test

133
Ohio English Language Arts Indicators Tested

134
A State Standards State Tests A

135
A State Standards State Tests NESS & Lexile

136
National Essential Skills Study (NESS)
")
137
NESS Study Subgroup Rankings
ELA Skill: Write clear and concise directions or procedures. Group Rank Overall 9 Business/Industry 2 Other Non-educators 10 English Language Arts Teachers 25 Other Educators 8

138
NESS Study Subgroup Rankings
ELA Skill: Give clear and concise oral directions. Group Rank Overall 7 Business/Industry 3 Other Non-educators 9 English Language Arts Teachers 28 Other Educators

139
NESS Study Subgroup Rankings
Math Skill: Apply the Pythagorean Theorem to right triangles. Group Rank Overall 20 Business/Industry 29 Other Non-educators 31 Mathematics Teachers 4 Other Educators 24

140
NESS Study Subgroup Rankings
Math Skill: Understand accuracy and precision of measurement, round off numbers according to the correct number of significant figures, and determine percent error. Group Rank Overall 12 Business/Industry 3 Other Non-educators 10 Mathematics Teachers 30 Other Educators 8

141
Proficiency

142
Interquartile Ranges Shown (25% - 75%)
Reading Study Summary Interquartile Ranges Shown (25% - 75%) 1600 1400 1200 Text Lexile Measure (L) 1000 800 600 High School Literature College Literature High School Textbooks College Textbooks Military Personal Use Entry-Level Occupations SAT 1, ACT, AP* * Source of National Test Data: MetaMetrics
 Text Lexile Measure (L) High. School. Literature. College. Literature. High. School. Textbooks. College. Textbooks. Military. Personal. Use. Entry-Level. Occupations. SAT 1, ACT, AP* * Source of National Test Data: MetaMetrics.")
143
A State Standards State Tests NESS & Lexile

144
A State Standards State Tests NESS & Lexile Common Core Standards

145
Road Map State Standards to State Test State Standards to Research
State Standards to CCSS CCSS to State Standard

146
Road Map State Standards to State Test State Standards to Research
State Standards to CCSS CCSS to State Standard State Test to CCSS Samples to NGA

147
Road Map State Standards to State Test State Standards to Research
State Standards to CCSS CCSS to State Standard State Test to CCSS Samples to NGA

148
Item Exemplars: Performance Task
Performance Task drawn from the Ohio Performance Assessment Project. Available at,

149
State Test NGA Create a large spinner for a game that has at least eight sectors. Each sector should be assigned a different ‘prize’. Prizes should range in value from most appealing to least appealing. Vary the sectors so that the probability to win a desired prize is much less that the probability to win a lesser desired prize. Calculate the theoretical probability of landing on each prize. Conduct multiple trials with the spinner and determine the experimental probability of landing on each prize. Which price has the greatest probability and which prize has the least probability?

150
A D State Standards State Tests NESS & Lexile Common Core Standards
Consortium Assessment

151
Gold Seal Lessons 151

152
Career & Technical Education
Ohio English Language Arts Benchmarks/Indicators Grade 10 OTG Agriculture, Food & Natural Resources Architecture & Construction Food Products & Processing Systems Agribusiness Systems Power, Structural & Technical Systems Environmental Service Systems Plant Systems Natural Resource Systems Animal Systems Design/ Pre- Construction Maintenance/ Operations 1. Define unknown words through context clues and the author’s use of comparison, contrast and cause and effect. H 2. Analyze the relationships of pairs of words in analogical statements (e.g., synonyms and antonyms, connotation and denotation) and infer word meanings from these relationships. L 3. Infer the literal and figurative meaning of words and phrases and discuss the function of figurative language, including metaphors, similes, idioms and puns. 4. Analyze the ways that historical events influenced the English language. 5. Use knowledge of Greek, Latin and Anglo-Saxon roots, prefixes and suffixes to understand complex words and new subject-area vocabulary (e.g., unknown words in science, mathematics and social studies). 6. Determine the meanings and pronunciations of unknown words by using dictionaries, glossaries, technology and textual features, such as definitional footnotes or sidebars. M 1. Apply reading comprehension strategies, including making predictions, comparing and contrasting, recalling and summarizing and making inferences and drawing conclusions.
 and infer word meanings from these relationships. L. 3. Infer the literal and figurative meaning of words and phrases and discuss the function of figurative language, including metaphors, similes, idioms and puns. 4. Analyze the ways that historical events influenced the English language. 5. Use knowledge of Greek, Latin and Anglo-Saxon roots, prefixes and suffixes to understand complex words and new subject-area vocabulary (e.g., unknown words in science, mathematics and social studies). 6. Determine the meanings and pronunciations of unknown words by using dictionaries, glossaries, technology and textual features, such as definitional footnotes or sidebars. M. 1. Apply reading comprehension strategies, including making predictions, comparing and contrasting, recalling and summarizing and making inferences and drawing conclusions.")
153
Grade 6 Achievement Test
Ohio Arts Education Ohio English Language Arts Benchmarks/Indicators Grade 6 NESS Grade 6 Achievement Test Visual Arts Dance Music Theatre 1. Define the meaning of unknown words by using context clues and the author’s use of definition, restatement and example. E5 H 1. Establish and adjust purposes for reading, including to find out, to understand, to interpret, to enjoy and to solve problems. E2 E12 2. Predict or hypothesize as appropriate from information in the text, substantiating with specific references to textual examples that may be in widely separated sections of text. E13 3. Make critical comparisons across texts, noting author’s style as well as literal and implied content of text. E24 4. Summarize the information in texts, recognizing important ideas and supporting details, and noting gaps or contradictions. E9 5. Select, create and use graphic organizers to interpret textual information. E6 E22 E31 M 6. Answer literal, inferential, evaluative and synthesizing questions to demonstrate comprehension of grade-appropriate print texts and electronic and visual media.

154
Net Network Resources Professional Development

155
Net Network Resources Professional Development Verb Analyzer
-continuous improvement

156
Net Network Resources Professional Development Verb Analyzer
-continuous improvement Video Cast

157
Net Network Resources Professional Development Verb Analyzer
-continuous improvement Video Cast Case Studies

158
Net Network Resources Professional Development Verb Analyzer
-continuous improvement Video Cast Case Studies Bulletins/Updates

159
Instructional Leadership Provide Professional Growth
Literacy and math Data-driven Curriculum Provide professional growth High expectations

160
A focus on college AND career ready
Successful Practices

161
Successful Practices A focus on college AND career ready
A common vision Successful Practices

162
Successful Practices A focus on college AND career ready
A common vision A culture of high expectations Successful Practices

163
Successful Practices A focus on college AND career ready
A common vision A culture of high expectations Literacy across the curriculum Successful Practices

164
Successful Practices A focus on college AND career ready
A common vision A culture of high expectations Literacy across the curriculum Rigor and Relevance for ALL students Successful Practices

165
Successful Practices A focus on college AND career ready
A common vision A culture of high expectations Literacy across the curriculum Rigor and Relevance for ALL students A culture of continuous improvement Successful Practices

166
Successful Practices A focus on college AND career ready
A common vision A culture of high expectations Literacy across the curriculum Rigor and Relevance for ALL students A culture of continuous improvement Leadership across all levels Successful Practices

167
Successful Practices A focus on college AND career ready
A common vision A culture of high expectations Literacy across the curriculum Rigor and Relevance for ALL students A culture of continuous improvement Leadership across all levels Focused and sustained professional development Successful Practices

168
23 Successful Practices

169
Successful Practices Network -Barrier Study-

170
Best Practices Level of Establishment Firmly Established
Partially Established In Planning Stage Not Evident Best Practices

171
Barriers Technical Cultural Political Insufficient Support
Insufficient Budget Insufficient Personnel Barriers

172
Technical – Cultural – is greatest barrier in 18 of the 23 successful practices Political Insufficient Support Insufficient Budget Insufficient Personnel Barriers

173
Barriers Technical – is greatest in 4 of the 23 successful practices
Cultural – is greatest barrier in 18 of the 23 successful practices Political Insufficient Support Insufficient Budget Insufficient Personnel Barriers

174
Barriers Technical – is greatest in 4 of 23 the successful practice
Cultural – is greatest barrier in 18 of the 23 successful practices Political Insufficient Support Insufficient Budget – is greatest in 1 of the 23 successful practices Insufficient Personnel Barriers

176
Career Ready Network

177
K-12 Education – High Impact Factors
3 2 1

178
Technology in Schools 3 2 1 1 – Computer Labs 2 – One-to-One Computing
3 – Bring Your Own Technology (BYOT) 3 2 1
")
179
Pencil Budget

180
Grading of Papers 3 2 1 1 – Training all teachers to grade essays
2 – Computer grading of essays 3 – Computer-based grading and immediate instruction based on performance 3 2 1

181
Learning 1 – Learning Together 1

182
Professional Development
1 – Student-run technology P.D. (survey/3 levels) 2 – Teachers are given technology IEP with students as their mentors 3 – Top 1/3rd students and teachers create alternative instructional delivery system 3 2 1
 2 – Teachers are given technology IEP with students as their mentors. 3 – Top 1/3rd students and teachers create alternative instructional delivery system")
183
Instruction 3 2 1 1 – Project-based Learning 2 – Flipped Classroom
3 – Online Game-based System 3 2 1

184
Teaching Rigor and Relevance Rigor and Relevance

185
Levels Bloom’s C D A B 4 5 6 3 2 1 Application

186
Rigor/Relevance Framework
Another way to think about the quadrants is who is doing the thinking and the work. When students are working and thinking, they are engaging in high rigor/high relevant activities. Aside to consultant: you may want to gauge the room to see how many people have heard of the Framework before, how many know it well, and how many know it very well. This session is not an overview of the Framework, if they would like more information, point them to Linda Jordan’s sessions in the program.

187
Quad D Skills and Knowledge
Decision Making Innovation/Creativity Goal Setting/Results Driven Multi Tasking Work with others

188
Teaching Relationships Relationships Rigor and Relevance

189
Rigor/Relevance Framework
D C 3 A B Calculate with numbers, including decimals, ratios, percents, and fractions. Understand two-dimensional motion and trajectories by separating the motion of an object into x and y components. 2 1 1 2 3 4 5

190
Rigor/Relevance Framework
D C 3 A B Know the characteristics and phenomena of sound waves and light waves. Understand the effect of sounds, words, and imagery on a listening audience. 2 1 1 2 3 4 5

191
Teaching Content Content Relationships Rigor and Relevance

192
Teaching How Students Learn How students learn Content Relationships
Rigor and Relevance

193
D C A B

194
How Students Learn

195
D C A B

196
Instructional Strategies
Teaching Instructional Strategies How students learn Content Instructional strategies Relationships Rigor and Relevance

197
Assessment to Guide Instruction
Teaching Assessment to Guide Instruction How students learn Content Instructional strategies Relationships Assessment to guide instruction Rigor and relevance

200
Doctor Pilot

201
Our Mission 3 2 1 1 – Teaching 2 – Learning
3 – Personalization of Learning 3 2 1

202
Recommendations

203
Recommendations Self Reflection -Barrier Study

204
23 Best Practices A focus on college AND career ready
A culture of high expectations Literacy across the curriculum A culture of continuous improvement A common vision Leadership across all levels Focused and sustained professional development 23 Best Practices

205
Best Practices Level of Establishment Firmly Established
Partially Established In Planning Stage Not Evident Best Practices

206
Barriers Technical Cultural Political Insufficient Support
Insufficient Budget Insufficient Personnel Barriers

207
Technical – Cultural – is greatest barrier in 18 of the 23 successful practices Political Insufficient Support Insufficient Budget Insufficient Personnel Barriers

208
Barriers Technical – is greatest in 4 of the 23 successful practices
Cultural – is greatest barrier in 18 of the 23 successful practices Political Insufficient Support Insufficient Budget Insufficient Personnel Barriers

209
Barriers Technical – is greatest in 4 of 23 the successful practice
Cultural – is greatest barrier in 18 of the 23 successful practices Political Insufficient Support Insufficient Budget – is greatest in 1 of the 23 successful practices Insufficient Personnel Barriers

210
Recommendations Self Reflection -Barrier Study

211
Recommendations Self Reflection -Barrier Study
-ICLE we analyze and suggest actions that should be taken

212
Recommendations Self Reflection -Barrier Study -We Surveys

213
Survey Tools for Rigor, Relevance and Relationships
WE™ Learn Student Survey WE™ Teach Instructional Staff Survey WE™ Lead Whole Staff Survey

214
Teacher vs. Student Comparison
T – Students can apply what I am teaching to their everyday lives. 92% S – I can apply what I learn to my everyday life. 58%

215
Teacher vs. Student Comparison
T – Students in my classroom engage in hands-on activities. 88% S – We do lots of hands-on activities in my classes. 45%

216
Teacher vs. Student Comparison
T – I make learning exciting for my students. 84% S – My teachers make learning exciting. 40%

217
Teacher vs. Student Comparison
T – I recognize students when they demonstrate positive behavior in school. 95% S – Good citizenship is rewarded in this school. 40%

218
Recommendations Self Reflection Needs Assessment

219
Recommendations Self Reflection Needs Assessment Strategic Plan

220
SUCCESS BY DESIGN NOT BY CHANCE

221
Recommendations Self Reflection Needs Assessment Strategic Plan
-Comprehensive

223
CULTURE DRIVES STRATEGY

224
Recommendations Self Reflection Needs Assessment Strategic Plan
-Comprehensive -Coaching

225
Recommendations Self Reflection Needs Assessment Strategic Plan
-Comprehensive -Coaching -Professional Development

226
Recommendations Self Reflection Needs Assessment Strategic Plan
-Comprehensive -Coaching -Professional Development -Tools

227
Take off the plate

228
Next Network

229
Next Network 1 2 3 4 5

230
Recommendations Self Reflection Needs Assessment Strategic Plan
-Comprehensive -Coaching -Professional Development -Tools 4. Career Ready Network

Similar presentations


>")


