Download presentation
Presentation is loading. Please wait.

1
Dave Rutledge, Caltech 2013 GSA Annual Meeting, Denver
Projections for Ultimate Coal Production from Production Histories Through 2012 Dave Rutledge, Caltech 2013 GSA Annual Meeting, Denver

2
Outline Projections from regional coal histories
Projection for world coal production Comparisons with the scenarios used by climate modelers Update of David Rutledge, 2011, “Estimating long-term world coal production with logit and probit transforms,” International Journal of Coal Geology

3
A Representative Cumulative Production Curve
Q is the ultimate production, or long-term production, past and future Until the last mine is shut down, Q needs to be estimated The ultimate production for the world is the important number for climate change—some components of the climate system have long time constants 𝑡 90% is the time at 90% exhaustion One way to answer the question, how long will the coal last? Coal production would not be finished at 𝑡 90% , but it gives a time frame for thinking about alternatives and reducing consumption No peak years will be predicted for coal—historically, coal regions have peaked at quite different phases of the production cycle

4
Recent Milestones in Climate Change
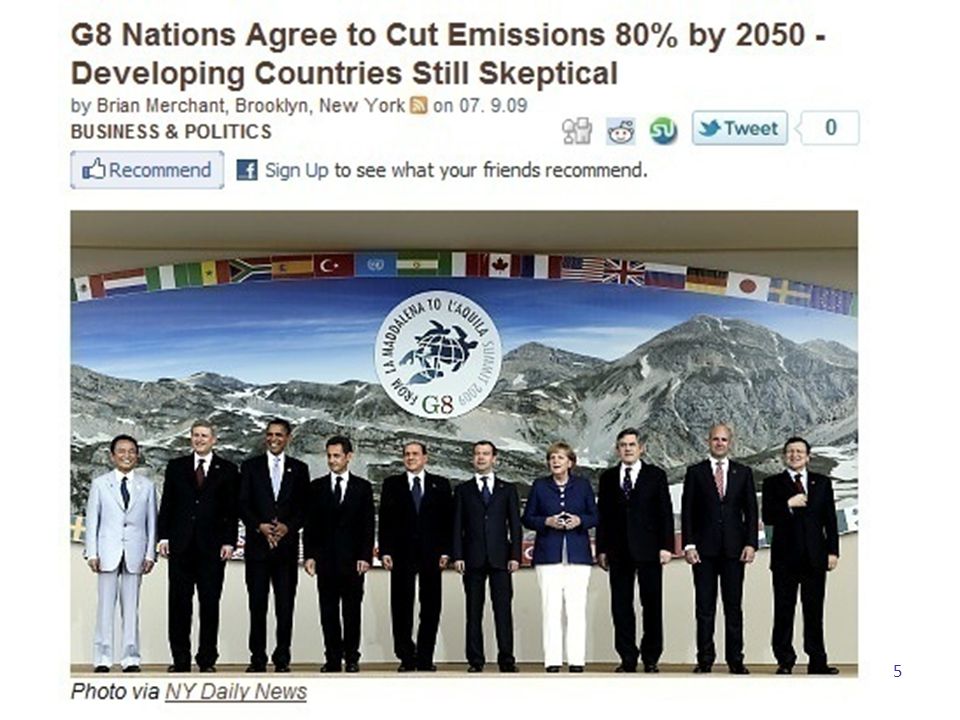
2009: At the G8 meeting in L’Aquila, Italy, leaders set the goal of reducing fossil-fuel CO2 emissions 80% by 2050 2012: the 1997 Kyoto Agreement to reduce CO2 emissions finished up — the most significant lack of support was from the United States, which did not ratify, and from Canada, which ratified, but withdrew 2014: UN IPCC (Inter-Governmental Panel on Climate Change) plans to finish its 5th Assessment Report
 plans to finish its 5th Assessment Report.")
6
The Kyoto Agreement World fossil-fuel carbon-dioxide emissions from the BP Statistical Review For an 80% reduction by 2050—imagine the collapse of the Soviet Union, repeated four times, voluntarily

7
Alternatives Share in World Primary Energy Production
From Brian Mitchell, International Historical Statistics, the BP Statistical Review and FAO (UN) and Arnulf Grubler, Technology and Global Change Since 1985, locked in a range from 14% to 16% Will make projections that do not depend on climate or alternatives policy
 and Arnulf Grubler, Technology and Global Change. Since 1985, locked in a range from 14% to 16% Will make projections that do not depend on climate or alternatives policy.")
8
British Coal Photo by John Cornwell
John Cornwell Collection of Coal Mining Photographs Coal trams, Merthyr Vale Colliery, Aberfan From Celebrating the Jewels, October 2003 By May 2003 the website at gtj.org.uk will contain over 20,000 images of Welsh life through the ages. These have been gathered from hundreds of museums, libraries, record offices and archives throughout Wales, putting them in one collection for the first time available to all free of charge. British Coal Photo by John Cornwell

9
Stanley Jevons, 1865 The Coal Question

10
UK Coal Production Mt = millions of metric tons
From Brian Mitchell, International Historical Statistics Three collieries left with an active longwall (Hatfield, Kellingley, Thoresby)—down from 803 faces in 1972
—down from 803 faces in")
11
Logistic Model for the Cumulative UK Coal Production
Cumulative production through 2012 is 27.4Gt and reserves are 228Mt A logistic curve fit to the production history in 1900 would have given 27.9Gt as a projection for the ultimate production The range of the curve fits for the ultimate production since 1900 is narrow, 27–30Gt, and it seems to have captured the correct value

12
Historical Projections Compared with Reserves
Produced only 19% of the 1871 Royal Commission reserves + cumulative Criteria chosen were too optimistic―1-ft seams, 4,000-ft depth Severe downgrade of reserves in 1968―late in the cycle (t87%)
")
13
UK Coal Linearized with the Logit Transform
The approach is described in David Rutledge, 2011, “Estimating long-term world coal production with logit and probit transforms,” International Journal of Coal Geology Q is found by a single-parameter fit by maximizing r2 Once Q has been determined, t90% is calculated from a regression formula For the UK, t90% (1984) was the year of the coal miner strike against the Thatcher government and a time of rising North Sea oil production
 was the year of the coal miner strike against the Thatcher government and a time of rising North Sea oil production.")
14
German Hard Coal Production
From the German Hard Coal Association Large drops during the world wars Down to three mines: August Victoria, scheduled to shut down in 2015, and Prosper-Hamel and Ibbenburen, which will close in 2018 Germany has subsidized hard coal production at several times the world price—the cumulative subsidy is 200G€ This may be the closest we will get in the real world to “technically recoverable coal”—because of the subsidy

15
Logistic Model for the Cumulative German Hard Coal Production
Cumulative production through 2012 is 12.1Gt and reserves are 48Mt The production drops during the wars would have prevented the early projections for ultimate production from being of much use—the projections did not stabilize to an appropriate range until 1970

16
Historical Projections Compared with Reserves for German Hard Coal
Produced only 14% of the early reserves Severe downgrade of reserves in 2004―very late (t99%) One problem with German government resource assessments is that they show signs of political influence―for example, the BGR lists hard coal resources as 83Gt, more than the cumulative production of the United States
 One problem with German government resource assessments is that they show signs of political influence―for example, the BGR lists hard coal resources as 83Gt, more than the cumulative production of the United States.")
17
Summary for Mature Coal Regions
2012 production Mt Cumulative production Gt Long-term production projection Gt Long-term production projection range Gt Early reserves + cumulative Gt Reserves year Long-term production projection as % of early reserves + cumulative United Kingdom 16.8 27.4 28.8 (11% span) 153 1871 19% Pennsylvania anthracite 2.1 5.04 5.05 (40% span) 12 1921 42% France and Belgium 0.1 7.2 7.6 (56% span) 33 1936 23% Japan and South Korea 3.4 3.6 3.7 (44% span) 17 21% Germany hard coal 10.8 12.1 12.2 - 86 1913 14% Estimate of the long-term production based on the early reserves were four times too high, on average Where feasible, curve fits gave reasonable estimates of the eventual long-term production (20% on average)
 % Pennsylvania anthracite (40% span) % France and Belgium (56% span) % Japan and South Korea (44% span) % Germany hard coal % Estimate of the long-term production based on the early reserves were four times too high, on average. Where feasible, curve fits gave reasonable estimates of the eventual long-term production (20% on average)")
18
Western US Coal Production
Early production cycle peaked in 1918 — centered on Colorado, extremely limited by lack of railroad capacity to customers New start after the 1970 Clean-Air Act Extension, which encouraged the use of low-sulfur coal, and the 1980 Staggers Rail Act, which deregulated the railroads

19
Western US Coal Production
Long-term production fit is 42Gt This amounts to 26% of reserves + cumulative production (160Gt)
")
20
Historical Projections Compared with Reserves for US Coal
Marius Campbell of the USGS did the first reserves in 1913 Paul Averitt was responsible for the reserves from He responded to criticism from mining engineers by tightening reserves criteria — seams at least 28 inches thick, up to 1,000 feet deep, within 3/4 mile from a measurement, 50% recovery The reserves are now 16 times lower than in 1913

21
Chinese Coal From Elspeth Thomson, The Chinese Coal Industry, and Economic History 46% of world’s production in 2012 The Asia Times reported that Chinese production through July is off 4% this year—stay tuned

22
Cumulative Production with Curve Fits
Similar trends for the Republic of China and the People’s Republic Curve fit for long-term production is 211Gt (122% of reserves + cumulative)
")
23
Historical Fits for Long-Term Production Compared with Reserves
Reserves submitted to World Energy Council in 1989 and 1992 differ by 6:1 Reflects historical indifference to reserves estimation by Chinese governments

24
Summary for Active Regions
2012 production Mt Cumulative production Gt Long-term production projection Gt Reserves + cumulative Gt Long-term production projection/ (reserves + cumulative) Long-term production projection range Gt Regression t90% Australia 436 12 46 88 52% (53%) 2073 China 3,650 62 211 173 122% (54%) 2060 Africa 254 9 18 41 45% (63%) 2048 Europe 768 86 134 201 67% (0.4%) 2078 Russia 496 28 52 222 24% - 2079 Western United States 537 42 160 26% (18%) 2051 Eastern United States 383 49 76 138 55% (12%) 2071 Canada 67 3 5 10 46% 4 - 5 (22%) 2032 South Asia 1,128 20 117 (30%) Latin America 111 2 19 (63%) 2081 World with mature regions 7,863 334 736 1,218 60% (16%) 2067 Projection ranges from 1994 on The fits for Q for South Asia and Latin America do not converge—for these the projection for ultimate production is reserves + cumulative production (this gives the world projection a modest high bias)
 Long-term production projection range Gt. Regression t90% Australia % (53%) China. 3, % (54%) Africa % (63%) Europe % (0.4%) Russia % Western United States % (18%) Eastern United States % (12%) Canada % (22%) South Asia. 1, (30%) Latin America (63%) World with mature regions. 7, , % (16%) Projection ranges from 1994 on. The fits for Q for South Asia and Latin America do not converge—for these the projection for ultimate production is reserves + cumulative production (this gives the world projection a modest high bias)")
25
World Coal Production The projection range from 1994 on is 16%
Current long-term fit is 736Gt (397GtC), 60% of reserves + cumulative
, 60% of reserves + cumulative.")
26
The IPCC’s Modeling Approach Representative Concentration Pathways (RCPs)
Completed Specify an interval in radiation forcing between RCPs that is meaningful in climate terms 1.5W/m2 Specify radiation forcings at this interval — 3, 4.5, 6 W/m2 plus the big one at 8.5 W/m2 (the 3W/m2 scenario actually peaks earlier at 3W/m2 and declines to 2.6W/m2 by 2100) Specify gas concentrations that give these forcings for climate modelers Ongoing work Develop an economic story for each RCP that gives these gas concentrations A different modeling group is responsible for each RCP—no systematic economic relationship between the RCPs (unlike the forcings) Limited information so far on coal production in the RCPs, except RCP 8.5 Danger of this approach is that there may be little relationship to the actual historical mining experience
 Specify gas concentrations that give these forcings for climate modelers. Ongoing work. Develop an economic story for each RCP that gives these gas concentrations. A different modeling group is responsible for each RCP—no systematic economic relationship between the RCPs (unlike the forcings) Limited information so far on coal production in the RCPs, except RCP 8.5. Danger of this approach is that there may be. little relationship to the actual historical mining experience.")
27
Coal in RCP 8.5 From Keywan Riahi et al., 2011, Climatic Change, “RCP 8.5—A Scenario of comparatively high greenhouse gas emissions” (this is the refereed journal definition of the RCP) and the RCP data base at The Riahi et al. paper does not mention coal resources—may reflect severe criticism of the SRES scenarios in the earlier assessment reports Conversion factors for comparisons: energy 21GJ/t and CO2 0.54tC/t
 and the RCP data base at The Riahi et al. paper does not mention coal resources—may reflect severe criticism of the SRES scenarios in the earlier assessment reports. Conversion factors for comparisons: energy 21GJ/t and CO2 0.54tC/t.")
28
Coal Emissions in RCP 8.5 Coal dominates future fossil-fuel CO2 emissions in RCP 8.5—65% The long-term coal production in RCP 8.5 is 6.6Tt 9x the projection for ultimate coal production 5x reserves plus cumulative production This is completely contrary to the historical experience—RCP 8.5 should not be used for any purpose

29
Fossil-Fuel Comparisons with all the RCPs
Scenario (includes cumulative production) Total CO2 emissions, TtC RCP 2.6 (3W/m2 peak) 0.3 Projection coal (397GtC), oil and gas (529GtC) 0.9 Reserves coal (658GtC), oil and gas (508GtC) 1.2 RCP 4.5 1.5 RCP 6.0 2.4 RCP 8.5 5.6 RCP CO2 emissions from the RCP data base, oil and gas reserves from BP RCP 2.6’s future net fossil-fuel CO2 emissions are negative—is this plausible? For oil and gas, the projection from a curve fit is similar to the reserves Not clear how relevant Venezuela’s 297Gb reserves (R/P 291y) are to a climate model US reserves have historically underestimated future US production A disadvantage of oil and gas reserves compared to projections based on production data is that reserves have historically been subject to political manipulation The uncertainties due to differences between projections and reserves and variations with time do not appear to be significant from a climate perspective
 Total CO2 emissions, TtC. RCP 2.6 (3W/m2 peak) 0.3. Projection coal (397GtC), oil and gas (529GtC) 0.9. Reserves coal (658GtC), oil and gas (508GtC) 1.2. RCP RCP RCP RCP CO2 emissions from the RCP data base, oil and gas reserves from BP. RCP 2.6’s future net fossil-fuel CO2 emissions are negative—is this plausible For oil and gas, the projection from a curve fit is similar to the reserves. Not clear how relevant Venezuela’s 297Gb reserves (R/P 291y) are to a climate model. US reserves have historically underestimated future US production. A disadvantage of oil and gas reserves compared to projections based on production data is that reserves have historically been subject to political manipulation. The uncertainties due to differences between projections and reserves and variations with time do not appear to be significant from a climate perspective.")
30
Conclusions For the mature coal regions, the ultimate production has been typically been a quarter of the early reserves—on the other hand, curve fits captured the ultimate in a ±20% range The current projection for ultimate world coal production is 60% of the reserves plus cumulative production—cf 58% in the 2011 paper 𝑡 90% for world coal is 2067—cf 2070 in the 2011 paper This should be viewed as a current trend that could be altered by future events, like the collapse of the Soviet Union The experience in Europe and in California has shown alternatives electricity shares can be increased by several percent per year It would be difficult to argue that coal exhaustion is a reason for shifting to electricity alternatives now There is little relationship between the RCPs and the actual historical experience of oil, gas, and coal production Would be preferable to substitute for the RCPs a single projection based on curve fits to the production histories, with an updated projection each year when the production data become available

Similar presentations


 Results WG III Folie 1 A Short Overview of the IPCC Report on Climate Change Mitigation 2007 (WG III) Prof. Dr.>")


 Grants Chapter 6.>")
