Download presentation
Presentation is loading. Please wait.

1
Measuring Fluid Pressure

2
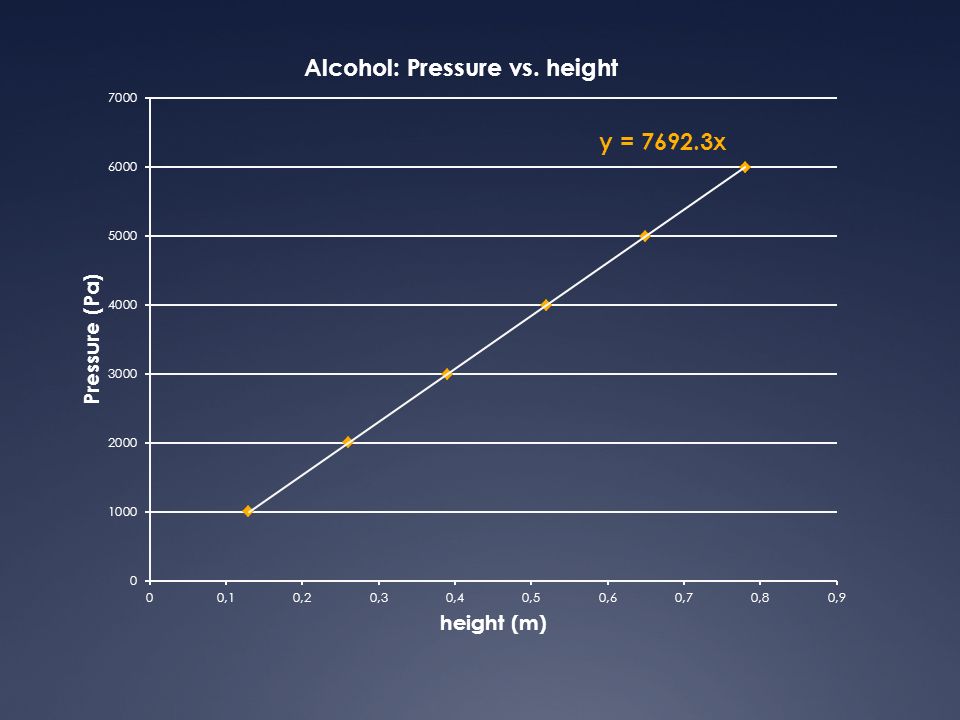
Sample data: Alcohol Height (m)Pressure (Pa) 0.131000 0.262000 0.393000 0.524000 0.655000 0.786000
Pressure (Pa)")
4
Slope of Pressure vs height Slope = rise/run = Pressure/height Pa = N = kg m = kg m m m 2 m m 3 sec 2 m 3 sec 2 kg/m 3 = density = ρ m/sec 2 = acceleration

5
Best fit equation = slope Alcohol = 7692.3 x Y= mx + b Pressure = 7692.3 h + b ( b can be disregarded. When pressure = 0 then height would = 0)
.")
6
Pressure vs height Pressure (Pa) Height (m) Glycerin Salt water Fresh water Alcohol
 Height (m) Glycerin Salt water Fresh water Alcohol")
7
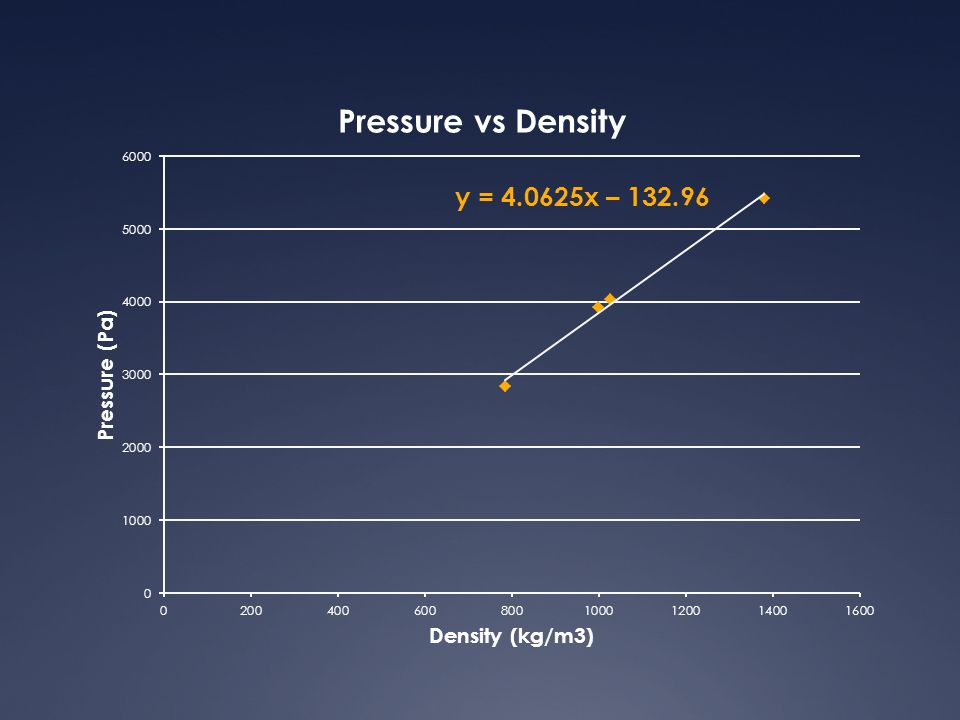
Pressure vs density using the best fit lines LiquidDensity (ρ) Kg/m 3 Best fit equation Equation at 0.4 m Alcohol785.47705 h2830 Freshwater10009810 h3924 Saltwater102710075 h4033 Glycerin126113538 h5415
 Kg/m 3 Best fit equation Equation at 0.4 m Alcohol h2830 Freshwater h3924 Saltwater h4033 Glycerin h5415")
9
Pressure is proportional to height P α h and P α ρ So therefore: P α ρ h × some constant C P = C ρ h

10
C = P = Pa = N/m 2 * m 3 ρ h kg/m 3 * m kg * m = kg * m * m 3 m 2 * kg * m * sec 2 C = m/ sec 2

11
Finding C (using data for seawater) P = C ρ h C = P = 1 P ρ h ρ h C = 1 * 10 075 1027 C = 9.81 m/sec 2 Slope Trend line formula
 P = C ρ h C = P = 1 P ρ h ρ h C = 1 * C = 9.81 m/sec 2 Slope Trend line formula")
Similar presentations


 volume (cm 3 ) DETERMINE VOLUME: DETERMINE MASS: RT = Pg. 1.>")


 The purpose of linearization is to get the equation that describes real.>")