Download presentation
Presentation is loading. Please wait.

1
Cardiovascular disease and vascular calcification in CKD
Professor Philip A Kalra Consultant and Honorary Professor of Nephrology Salford Royal Hospital and University of Manchester, UK

2
Key topics Epidemiology of CVS risk Non-traditional CVS risk factors
In dialysis patients Non-dialysis CKD SCD Non-traditional CVS risk factors Cardiac structural changes CKD-MBD : importance of phosphate

3
Rates of death and cardiovascular events rise as renal function declines
Death from any cause Cardiovascular events Age-standardised rate per 100 person years Go AS, Chertow GM, Fan D, McCulloch CE, Hsu CY. Chronic kidney disease and the risks of death, cardiovascular events, and hospitalization. N.Engl.J Med. 2004;351: Estimated GFR (ml/min/1.73 m2) Go et al et al. NEJM : 351(13): 3 3
 Go et al et al. NEJM : 351(13):")
4
Chronic Renal Insufficiency Standards Implementation Study (CRISIS)
Mean age 65 yrs eGFR 31 ml/min Diabetes 32% CVS disease (baseline) 47% 1325 patients with mean FU of 34 months
 47% 1325 patients with mean FU of 34 months.")
5
CRISIS : survival

6
Cause of death (ONS) %
 %")
7
Cardiovascular Mortality Rates are Higher among Dialysis Patients
100 10 1 Dialysis: male 0.1 Dialysis: female General population: male 0.01 General population: female 0.001 Adapted from Levey AS et al. Am J Kidney Dis 1998; 32: 7

8
4D Study: Primary composite endpoint
Relative Risk Reduction 8 % (95 % CI: -23%, +10%, P=0.37) 60 N=1255 HD pts with type 2 diabetes Cardiac death, non-fatal MI or stroke Mean follow-up 4 years 50 40 Cumulative incidence (%) 30 Placebo 20 Atorvastatin 20 mg 10 1 2 3 4 5 5.5 years Years from Randomization Placebo Atorvastatin Wanner et al NEJM 2005;353:
 60. N=1255 HD pts with type 2 diabetes. Cardiac death, non-fatal MI or stroke. Mean follow-up 4 years Cumulative incidence (%) 30. Placebo. 20. Atorvastatin 20 mg years. Years from Randomization. Placebo Atorvastatin Wanner et al NEJM 2005;353:")
9
Cardiovascular Disease in CKD : Multifactorial Pathogenesis
Elevated PTH/ 2°HPT Duration of dialysis Dyslipidemia Oxidative stress Hypertension Exogenous vitamin D/deficit Cardiovascular Disease Diabetes Mellitus Chronic inflammation Genetics Hyperphos-phatemia This diagram represents the many factors that may contribute to cardiovascular calcification in CKD. A good number of these factors are “traditional”—that is, they are at work in the general population as well as the CKD population. 1Qunibi QY, Nolan CA, Ayus JC. 2Hujairi NM, Afzali B, Goldsmith DJ.. Am J Kidney Dis. 2004; 43: 3Goodman WG, et al. N Engl J Med. 2000; 342: 1478 –1483. 4Locatelli F. et al. Nephrol Dial Transplant. 2001; 16: 5Chertow GM, et al.. Kidney Int. 2002;62: 6Guerin AP, et al.. Nephrol Dial Transplant : Smoking Exogenous Ca intake Increased homocysteine levels Elevated Ca × P product Traditional risk factors Non Traditional risk factors 9 9

10
Definition of Sudden Cardiac Death (SCD)
Sudden cardiac death is the unexpected natural death from a cardiac cause within one hour of the onset of symptoms in a person not known to have a condition that is potentially fatal

11
Epidemiology of SCD : general population
1 in every 1000 deaths thought to be due to SCD SCD is usually the 1st cardiac event that a patient will suffer 80% have abnormal coronary arteries Risk is > in immediate post-MI period Poor LV function (particularly due to ischemic cardiomyopathy) and a documented history of significant ventricular arrhythmia, are the strongest predictors of SCD
 and a documented history of significant ventricular arrhythmia, are the strongest predictors of SCD.")
12
Mechanism of SCD : general population
Myocardial infarction and poor left ventricular function both lead to risk of re-entrant ventricular tachycardia (VT) : MI : by post-infarction scarring LV failure : by abnormal fibrotic myocardial remodelling These areas of abnormal tissue may still contain functioning myocytes, but the surrounding scar tissue is thought to cause bundle branch block, and predispose to subsequent re-entrant tachycardia
 : MI : by post-infarction scarring. LV failure : by abnormal fibrotic myocardial remodelling. These areas of abnormal tissue may still contain functioning myocytes, but the surrounding scar tissue is thought to cause bundle branch block, and predispose to subsequent re-entrant tachycardia.")
13
Epidemiology of SCD : CKD populations
CKD stages 3-5 (not dialysis) SCD risk ↑ by HR of 1.1 for every 10ml/min decline in eGFR Event rate 0.8% per yr in non-dialysis CKD In non-diabetic dialysis patients, rate is 7% in 1st yr of RRT SCD risk is > for HD than PD patients during 1st 6 months of dialysis, but equalises thereafter CKD Dialysis General
 SCD risk ↑ by HR of 1.1 for every 10ml/min decline in eGFR. Event rate 0.8% per yr in non-dialysis CKD. In non-diabetic dialysis patients, rate is 7% in 1st yr of RRT. SCD risk is > for HD than PD patients during 1st 6 months of dialysis, but equalises thereafter. CKD. Dialysis. General.")
14
Monday or Tuesday (greatest risk last 12 hrs before dialysis)
Karnik JA et al (Kidney International 2001:60: ) : Characteristics associated with arrest on haemodialysis Monday or Tuesday (greatest risk last 12 hrs before dialysis) Low potassium dialysate Older age Diabetic Catheter for access
 : Characteristics associated with arrest on haemodialysis. Monday or Tuesday (greatest risk last 12 hrs before dialysis) Low potassium dialysate. Older age. Diabetic. Catheter for access.")
15
CVS risk factors in CKD Cardiac structural changes – LVH and CCF CAD
Vascular calcification/arterial stiffness Phosphate Vitamin D deficiency Anaemia Metabolic changes Inflammation

16
Prevalence of Left Ventricular Hypertrophy in Relation to Creatinine Clearance
p <0.003 (trend analysis) In a prospective multicentre study, Canadian investigators evaluated the prevalence of LVH in relation to creatinine clearance in this group of 246 patients with mild to moderate renal insufficiency. The investigators divided the patients into discrete groups by predefined categories of mild (Ccl = mL/min), moderate (Ccl = mL/min), or severe (Ccl <25 mL/min) renal insufficiency and dialysis. As this slide shows, the prevalence of LVH is related to the degree of renal insufficiency (p <0.003 [trend analysis]) Levin A, Thompson CR, Ethier J, et al. Left ventricular mass index increase in early renal disease: impact of decline in hemoglobin. Am J Kidney Dis 1999; 34: Patients with diabetes = 24% Adapted from Levin A et al. Am J Kidney Dis 1999; 34: 16
 In a prospective multicentre study, Canadian investigators evaluated the prevalence of LVH in relation to creatinine clearance in this group of 246 patients with mild to moderate renal insufficiency. The investigators divided the patients into discrete groups by predefined categories of mild (Ccl = mL/min), moderate (Ccl = mL/min), or severe (Ccl <25 mL/min) renal insufficiency and dialysis. As this slide shows, the prevalence of LVH is related to the degree of renal insufficiency (p <0.003 [trend analysis]) Levin A, Thompson CR, Ethier J, et al. Left ventricular mass index increase in early renal disease: impact of decline in hemoglobin. Am J Kidney Dis 1999; 34: Patients with diabetes = 24% Adapted from Levin A et al. Am J Kidney Dis 1999; 34:")
19
Intra-dialytic myocardial ischaemia
C McIntyre and colleagues (Derby, UK) : Haemodialysis induces reversible intra-dialytic myocardial stunning ↑stunning associated with greater propensity to arrhythmia ↑stunning associated with worse mortality Some relationship between endotoxaemia and myocardial ischaemia
 : Haemodialysis induces reversible intra-dialytic myocardial stunning. ↑stunning associated with greater propensity to arrhythmia. ↑stunning associated with worse mortality. Some relationship between endotoxaemia and myocardial ischaemia.")
20
Calcification of the coronary arteries
Pre-contrast Post-contrast Khogali and Townend NEJM 2002;347:1584

21
Arterial Medial Calcification in ESRD
London GM, et al. Nephrol Dial Transplant. 2003;18:

22
Prevalence of Vascular Calcification in CKD
Patients New to Dialysis and Established Patients *** Stage 3-4 CKD ** * *Russo et al AJKD 2004 (CrCl =33 ml/min) **Spiegel D et al. Hemod Internat 2004: 8:265 ***Chertow et al KI 2002
 **Spiegel D et al. Hemod Internat 2004: 8:265. ***Chertow et al KI")
23
Probability of All-Cause Survival According to Calcification Status
0.00 0.25 0.50 0.75 1.00 Calcification Score: 0 Calcification Score: 1 Calcification Score: 2 Probability of Survival Calcification Score: 3 Prospective studied 110 ESRD HD patients Ultrasound looking for arterial calcification at the carotid artery, abdomainal aorta, iliofemoral axis and legs. Follow up 53 months All cause mortality increased 90 % per 1 site increase in calcifacation score, CV mortality increased 260% The presence and extent of vascular calcifications were strong predictors of cardiovascular and all cause mortality. Carotid incremental elastic modulus gave ADDItiONAL predictive value. Calcification Score: 4 20 40 60 80 Duration of Follow-Up (Months) *Comparison Between Curves Was Highly Significant (x2=42.66, P<0.0001) Source: Blacher A, et al. Hypertension: , October 2001 23 23
 *Comparison Between Curves Was Highly Significant (x2=42.66, P<0.0001) Source: Blacher A, et al. Hypertension: , October")
24
Augmentation index : Applanation Tonometry
CRISIS – chronic renal insufficiency standards implementation study – running since 2002 up to now - clinical and biochemical parameters of 792 pre-dialysis patients in the Hope Hospital CKD programme, with information on cardiovascular risk factors and current medications Cross sectional analysis was carried out on 605 patients Technique involved applanation tonometry – probe held against radial artery over maximal area of pulsation (as shown in the picture) – waveform recorded on computer interfaced with SphygmoCor machine – 2 consecutive readings taken – quality controlled Ethical approval from COREC & informed consent Aortic Augmentation Index (%) = ∆P x 100 (AIx) PP
 – waveform recorded on computer interfaced with SphygmoCor machine – 2 consecutive readings taken – quality controlled. Ethical approval from COREC & informed consent. Aortic Augmentation Index (%) = ∆P x 100. (AIx) PP.")
26
Importance of phosphate

27
Serum Phosphorus and Mortality in Hemodialysis Patients
1.50 1.00 1.08 1.25 1.42 1.68 2.03 0.5 1 1.5 2 2.5 <3 3-4 4-5 5-6 6-7 7-8 8-9 >9 Serum Phosphorous Concentration (mg/dL) Relative Risk of Death* n = 40,538 P < *Multivariable Adjusted Block G, J Am Soc Neph 15: , 2004
 Relative Risk of Death* n = 40,538. P < *Multivariable Adjusted. Block G, J Am Soc Neph 15: ,")
28
CRISIS study : analysis of serum phosphate (Eddington H et al, CJASN 2010)
1213 patients Baseline demographics – Phosphate divided into quartiles Cox regression Baseline phosphate and survival Time-averaged phosphate and survival

29
Baseline demographics
All PO4 <1.01 N=318 PO – 1.16 N=300 PO N=293 PO4 ≥1.34 N=302 P value Age 64.2 (13.9) 64 (14) 65 (14) 62 (14) 0.037 Female sex 429 (35.4%) 76 (24%) 109 (36%) 124 (42%) 120 (40%) <0.0001 Calcium 2.29 (0.14) 2.29 (0.13) 2.29 (0.19) 2.30 (0.13) 2.28 (0.19) ns PTH 89 (86) 58 (42) 77 62) 86 (77) 135 (124) Hb 124 (18) 135 (18) 125 (16) 123 (14) 114 (17) eGFR 31.6 (15) 40 (14) 34 (13) 31 (14) 20 (11) Proteinuria 1.1 (1.8) 0.5 (0.7) 0.8 (1.2) 0.9 (1.2) 2.1 (2.7) CVD 380 (31%) 99 (31%) 99 (34%) 73 (24%) 0.009 DM 385(32%) 84 (27%) 89 (29%) 90 (29%) 122 (40%) 0.002
 64 (14) 65 (14) 62 (14) Female. sex. 429 (35.4%) 76 (24%) 109 (36%) 124 (42%) 120 (40%) < Calcium (0.14) 2.29 (0.13) 2.29 (0.19) 2.30 (0.13) 2.28 (0.19) ns. PTH. 89 (86) 58 (42) 77 62) 86 (77) 135 (124) Hb. 124 (18) 135 (18) 125 (16) 123 (14) 114 (17) eGFR (15) 40 (14) 34 (13) 31 (14) 20 (11) Proteinuria. 1.1 (1.8) 0.5 (0.7) 0.8 (1.2) 0.9 (1.2) 2.1 (2.7) CVD. 380 (31%) 99 (31%) 99 (34%) 73 (24%) DM. 385(32%) 84 (27%) 89 (29%) 90 (29%) 122 (40%)")
30
Baseline phosphate and survival
Adjusted for eGFR, Age, Gender, Hb, Diabetes, CVD, proteinuria, PTH Mean follow-up 4.3 years Phosphate <1.01 Phosphate Phosphate Phosphate >1.33 Hazard ratio 1.8 P = 0.04 n= n= n= n= n=136

31
12mth time-average PO4 survival
Adjusted for eGFR, Age, Gender, Hb, Diabetes, CVD, proteinuria, PTH Mean follow-up 3.6 years Phosphate <1.01 Phosphate Phosphate Phosphate >1.34 Phosphate <1.01 Phosphate Phosphate Phosphate >1.34 Hazard ratio 2.59 P = 0.006 Hazard ratio 2.12 P = 0.01 n= n= n= n=136

32
Survival according to previous KDOQI phosphate guidelines
Below Target In Target Above Target Hazard ratio: In target 1.9 ( ) P = 0.08 Above target 2.6 ( ) P = 0.03
 P = Above target 2.6 ( ) P =")
33
Phosphate : general population

34
CARDIA (Coronary artery risk development in young adults)
Prospective multi-centre observational study of CVS disease development in fit young adults (age yrs) in 4 US regions (Birmingham, Alabama; Chicago, Illinois; Minneapolis,Minnesota; Oakland, California) 5113 participants
 in 4 US regions (Birmingham, Alabama; Chicago, Illinois; Minneapolis,Minnesota; Oakland, California) 5113 participants.")
35
CARDIA (Coronary artery risk development in young adults)
Various baseline variables assessed LVMI assessed by echocardiography 5 years after entry Coronary artery calcification assessed by CT scan 15 years later

36
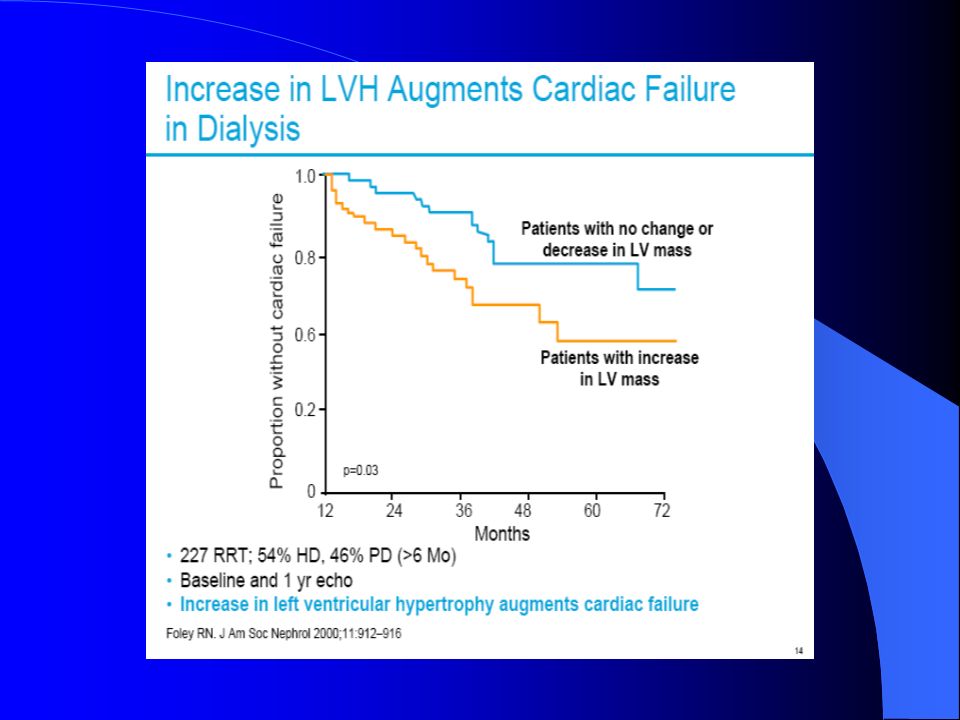
Left ventricular hypertrophy (LVH) : Foley RN et al Kid Blood Press Res 2009; 32(1):37-44
4005 of 5113 participants underwent echocardiography Baseline data Mean age 25 years Mean phosphate 3.7 mg/dl eGFR ml/min/1.73m2 Results Each SD of baseline phosphate above the mean was associated with ↑presence of LVH 5 years later (AOR 1.301, p=0.0018)
")
37
Coronary artery calcification (CAC) : Foley RN et al J Am Soc Neph 2009; 20(2): 397-404
3015 of 5113 participants underwent CT at 15 years Baseline data Mean age 25.2 years mean phosphate 3.6 mg/dl, calcium 9.5 mg/dl Mean eGFR ml/min/1.73m2 0.2% with eGFR < 60 ml/min/1.73m2

38
Coronary artery calcification (CAC) : Foley RN et al J Am Soc Neph 2009; 20(2): 397-404
Year 15 CAC scores Minimal % Mild % Moderate % Severe > %

39
P-Spline plot relating adjusted odds ratio of CAC ≥ 100 and serum phosphorus
AOR, with 95% confidence intervals. Adjusted for all variables except calcium-phosphorus product and diastolic blood pressure

40
Studies of phosphate in general population : conclusions
Phosphate levels even at the upper end of normal range appear to be a risk factor for : Coronary artery calcification (surrogate of coronary atherosclerosis) Left ventricular hypertrophy ? Pathogenetic effect or association
 Left ventricular hypertrophy. Pathogenetic effect or association.")
41
FGF-23/Klotho: New players in CKD-MBD
Pi 1,25D Small bowel Reduces Ca and Pi absorption in small bowel 1,25D 1α(OH)D3 Inhibits 1α-hydroxylase FGF-23 Parathyroid Possibly stimulates Phosphaturia + Klotho Stimulates Skeleton Possibly inhibits mineralization FGF23 inhibits PTH mRNA transcription and protein secretion Kidney Kuro-o. Keynote lecture from ERA-EDTA 2008, ASN 2008 Adapted from: Emmett M, et al. Kidney International 2008;73:3–5
D3. Inhibits 1α-hydroxylase. FGF-23. Parathyroid. Possibly stimulates. Phosphaturia. + Klotho. Stimulates. Skeleton. Possibly inhibits mineralization. FGF23 inhibits PTH mRNA transcription and protein secretion. Kidney. Kuro-o. Keynote lecture from ERA-EDTA 2008, ASN Adapted from: Emmett M, et al. Kidney International 2008;73:3–5.")
42
Haemodialysis patients within the highest range of FGF-23 levels had nearly 6x greater risk of death
Gutierrez OM et al; N Engl J Med 2008 :359;

43
Temporal aspects of mineral disorders in progressive CKD and post transplantation
Wolf JASN 2010

44
How might FGF-23 be associated with CVS risk?
↑ FGF-23 associated with ↓vitamin D, CKD progression and mortality in CKD ↑ FGF-23 associated with ↑ LVH (Gutierrez OM et al, Circulation 2009; 119 : ) ↑ FGF-23 associated with ↑ ADMA (asymmetric di-methyl arginine; an inhibitor of NO synthase) ↑ FGF-23 associated with ↓ flow-mediated dilatation (FMD) in CKD patients (Yilmaz MI et al, Kidney Int, 2010; 78 : )
 ↑ FGF-23 associated with ↑ ADMA (asymmetric di-methyl arginine; an inhibitor of NO synthase) ↑ FGF-23 associated with ↓ flow-mediated dilatation (FMD) in CKD patients (Yilmaz MI et al, Kidney Int, 2010; 78 : )")
45
Vitamin D levels very low in dialysis patients
52 Vitamin D naïve haemodialysis patients (>90% ‘deficient’) Mean PTH 345pg/ml ± 37 (245) Mean 25(OH)D 14.2 ± 1 (13.5) London GM et al JASN 2007: 18; (latitude 48o)
 Mean PTH 345pg/ml ± 37 (245) Mean 25(OH)D 14.2 ± 1 (13.5) London GM et al JASN 2007: 18; (latitude 48o)")
46
Vitamin D levels assoc with arterial function
London GM et al JASN 2007: 18; (latitude 48o)
")
47
Studies of intervention for vascular calcification

48
Treat-to-Goal Study : Prevalent haemodialysis patients
Sevelamer Calcium * * Median percentage change *Within treatment P<0.0001; between treatment groups P=0.02 Chertow et al. Kidney Int. 2002

49
ADVANCE :Study Endpoints
Percentage change from baseline in CAC score at week 52 Primary Endpoint Secondary Endpoints Percentage change from baseline in CAC score at week 52 Secondary Endpoints Absolute change in CAC score at week 52 Absolute and percentage change from baseline in Aortic calcification at week 52 Aortic valve calcification at week 52 Laboratory parameters at end of study (weeks 44 through 52) Proportion of patients achieving > 15% progression of CAC at week 52 Safety Data on file, Amgen [ADVANCE Protocol ; 6/22/2007]. Laboratory parameters = PTH, calcium, phosphorus and Ca x P Safety = nature, frequency, severity and relationship to treatment of adverse events Inclusion Criteria Informed Consent Adults ≥ 18 years of age On hemodialysis for ≥ 3 months prior to study day 1 iPTH > 300 pg/mL (31.8 pmol/L) OR iPTH 150 pg/mL and ≤ 300 pg/mL (15.9 – 31.8 pmol/L) and receiving treatment with vitamin D analogs at time of PTH assessment and corrected serum Ca x P > 50 mg2/dL2 (3.9 mmol2/L2) Corrected serum Ca ≥ 8.4 mg/dL (2.1 mmol/L) Screening CAC score ≥ 30 Subjects were subsequently stratified: ≥ 30–399, ≥ 400–999, and ≥ 1000 Concomitenet Therapy Changes in active vitamin D brand were to be avoided Calcium-containing phosphate binders Were to remain as stable as possible Best practice guidelines were to be followed Dialysate calcium concentration and cholesterol-lowering medications were to remain stable throughout study Not permitted Non–calcium containing phosphate binders [sevelamer HCl, lanthanum carbonate, aluminum-based phosphate binders]* Non-study cinacalcet Other investigational agents Raggi P et al. Poster presented at the 2010 Clinical Meeting of the National Kidney Foundation, Orlando, FL, April 13-17, 2010. Floege J et al. Poster presented at the 2010 ISN Nexus Meeting, Kyoto, Japan, April 15-18, 2010. 49
 Proportion of patients achieving > 15% progression of CAC at week 52. Safety. Data on file, Amgen [ADVANCE Protocol ; 6/22/2007]. Laboratory parameters = PTH, calcium, phosphorus and Ca x P. Safety = nature, frequency, severity and relationship to treatment of adverse events. Inclusion Criteria. Informed Consent. Adults ≥ 18 years of age. On hemodialysis for ≥ 3 months prior to study day 1. iPTH > 300 pg/mL (31.8 pmol/L) OR. iPTH 150 pg/mL and ≤ 300 pg/mL (15.9 – 31.8 pmol/L) and receiving treatment with vitamin D analogs at time of PTH assessment. and corrected serum Ca x P > 50 mg2/dL2 (3.9 mmol2/L2) Corrected serum Ca ≥ 8.4 mg/dL (2.1 mmol/L) Screening CAC score ≥ 30. Subjects were subsequently stratified: ≥ 30–399, ≥ 400–999, and ≥ Concomitenet Therapy. Changes in active vitamin D brand were to be avoided. Calcium-containing phosphate binders. Were to remain as stable as possible. Best practice guidelines were to be followed. Dialysate calcium concentration and cholesterol-lowering medications were to remain stable throughout study. Not permitted. Non–calcium containing phosphate binders [sevelamer HCl, lanthanum carbonate, aluminum-based phosphate binders]* Non-study cinacalcet. Other investigational agents. Raggi P et al. Poster presented at the 2010 Clinical Meeting of the National Kidney Foundation, Orlando, FL, April 13-17, Floege J et al. Poster presented at the 2010 ISN Nexus Meeting, Kyoto, Japan, April 15-18,")
50
Patient characteristics
737 patients were screened and 360 were randomized, 180 to each group. Mean (SD) age was 61.5 (12.7) years, 58% were male and 24% were black Median (P10, P90) time on hemodialysis was 36.7 (9.5, 107.0) months. The efficacy analysis included 235 subjects: 115 assigned to cinacalcet plus low dose vitamin D 120 assigned to flexible doses of vitamin D sterols Raggi P et al. Poster presented at the 2010 Clinical Meeting of the National Kidney Foundation, Orlando, FL, April 13-17, 2010. Floege J et al. Poster presented at the 2010 ISN Nexus Meeting, Kyoto, Japan, April 15-18, 2010.
 age was 61.5 (12.7) years, 58% were male and 24% were black. Median (P10, P90) time on hemodialysis was 36.7 (9.5, 107.0) months. The efficacy analysis included 235 subjects: 115 assigned to cinacalcet plus low dose vitamin D. 120 assigned to flexible doses of vitamin D sterols. Raggi P et al. Poster presented at the 2010 Clinical Meeting of the National Kidney Foundation, Orlando, FL, April 13-17, Floege J et al. Poster presented at the 2010 ISN Nexus Meeting, Kyoto, Japan, April 15-18,")
51
Median % Change (P10, P90) in CAC
Percent Change in Total Coronary Artery Calcification Score (CAC) – Agatston Primary Analysis Median % Change (P10, P90) in CAC Cinacalcet (n=115) Control group (n=119) p-value 24 (-22, 119) 31 (-9, 179) 0.073 Primary analysis based on a generalised Cochran-Mantel-Haenszel test on ranks Agatston Table: Volume Table Raggi P et al. Poster presented at the 2010 Clinical Meeting of the National Kidney Foundation, Orlando, FL, April 13-17, 2010. Floege J et al. Poster presented at the 2010 ISN Nexus Meeting, Kyoto, Japan, April 15-18, 2010. 51
 – Agatston. Primary Analysis. Median % Change (P10, P90) in CAC. Cinacalcet. (n=115) Control group. (n=119) p-value. 24 (-22, 119) 31 (-9, 179) Primary analysis based on a generalised Cochran-Mantel-Haenszel test on ranks. Agatston Table: Volume Table Raggi P et al. Poster presented at the 2010 Clinical Meeting of the National Kidney Foundation, Orlando, FL, April 13-17, Floege J et al. Poster presented at the 2010 ISN Nexus Meeting, Kyoto, Japan, April 15-18,")
52
Percent Change in Total Coronary Artery Calcification Score (CAC) - Agatston
Analysis adjusted for baseline phosphorus Geometric Mean % Change (95% CI) in CAC Cinacalcet (n=115) Control group (n=119) p-value 26 (16, 36) 42 (31, 54) 0.031 Supportive analysis (as planned in the protocol) using a generalised linear model to adjust for the baseline imbalance in phosphorous levels between treatment groups. Agatston Table: Volume Table Raggi P et al. Poster presented at the 2010 Clinical Meeting of the National Kidney Foundation, Orlando, FL, April 13-17, 2010. Floege J et al. Poster presented at the 2010 ISN Nexus Meeting, Kyoto, Japan, April 15-18, 2010. 52
 in CAC. Cinacalcet. (n=115) Control group. (n=119) p-value. 26 (16, 36) 42 (31, 54) Supportive analysis (as planned in the protocol) using a generalised linear model to adjust for the baseline imbalance in phosphorous levels between treatment groups. Agatston Table: Volume Table Raggi P et al. Poster presented at the 2010 Clinical Meeting of the National Kidney Foundation, Orlando, FL, April 13-17, Floege J et al. Poster presented at the 2010 ISN Nexus Meeting, Kyoto, Japan, April 15-18,")
53
Does reducing vascular calcification translate into survival benefit?

54
DCOR study: Primary Endpoint
0.6 RR 0.91 ( ), p = 0.30 0.5 n=2103 0.4 Cumulative Incidence of All-Cause Mortality 0.3 0.2 Results of the DCOR trial were inconclusive for the primary end-point of all-cause mortality across the entire patient cohort (RR 0.91; p = 0.3) Overall survival curve indicated need for treatment time analysis Cox proportional hazards models assumes that the treatment effect is constant over time. Survival curve indicates otherwise—change in curve beginning at 2 years Calcium 0.1 Sevelamer 0.0 1 2 3 4 Time in Study (Years) Suki et al, Kidney Int 2007;72: 54
, p = n= Cumulative Incidence of. All-Cause Mortality Results of the DCOR trial were inconclusive for the primary end-point of all-cause mortality across the entire patient cohort (RR 0.91; p = 0.3) Overall survival curve indicated need for treatment time analysis. Cox proportional hazards models assumes that the treatment effect is constant over time. Survival curve indicates otherwise—change in curve beginning at 2 years. Calcium Sevelamer Time in Study (Years) Suki et al, Kidney Int 2007;72:")
55
DCOR : All-Cause Mortality in Patients ≥ 65 years
0.0 0.1 0.2 0.3 0.4 0.5 0.6 0.7 0.8 Sevelamer therapy resulted in a statistically significant reduction in the relative risk for all-cause mortality in pre-specified subset [RR 0.78 ( )] Cumulative Incidence of All-Cause Mortality ↓ 22% p = 0.03 Sevelamer Calcium 1 2 3 4 Time on Study (Years) No. at Risk Calcium Sevelamer
] Cumulative Incidence of All-Cause Mortality. ↓ 22% p = Sevelamer. Calcium Time on Study (Years) No. at Risk. Calcium Sevelamer")
56
Final KDIGO Grading of Recommendations
During the development of the CKD-MBD guideline, KDIGO continued to develop a system for rating the strength of recommendations and the overall quality of evidence supporting those recommendations. A task force had been formed that ultimately made recommendations to the KDIGO Board. After extensive discussion and debate, the KDIGO Board of Directors in 2008 unanimously approved a modification of the Grades of Recommendation Assessment, Development, and Evaluation (GRADE) system. The system that was adopted allows provision of guidance even if the evidence base is weak, but makes the quality of the available evidence transparent and explicit. It is described in detail in the present CKD-MBD guideline (Chapter 2). Each recommendation is rated 1 or 2, with 1 being a “We recommend …” statement implying that most patients should receive the course of action, and 2 being a “We suggest …” statement implying that different choices will be appropriate for different patients. In addition, each statement is assigned an overall grade for the quality of evidence, A (high), B (moderate), C (low), or D (very low). The grade of each recommendation depends on the strength of the evidence, but also on additional considerations. A key issue is whether to include guideline statements on topics which can not be subjected to systematic evidence review. KDIGO has decided to meet this need by including some statements that are not graded. Typically, ungraded statements provide guidance that is based on common sense, e.g., reminders of the obvious, and/or recommendations that are not sufficiently specific enough to allow application of evidence. Examples include the frequency of laboratory testing and the provision of routine medical care. The CKD-MBD guideline encompasses many aspects of care for which there is little or no evidence to inform recommendations. Indeed, there are only three recommendations in the CKD-MBD guideline for which the overall quality of evidence was graded “A”, while 12 were graded “B”, 23 were graded “C”, and 11 were graded “D”. Although there are reasons other than quality of evidence to make a grade 1 or 2 recommendation, in general, there is a correlation between the quality of overall evidence and the strength of the recommendation. Thus, there are 10 recommendations graded “1” and 39 graded “2”. There were two recommendations graded “1A”, five were “1B”, three were “1C”, and none were “1D”. There was one graded “2A”, seven were “2B”, 20 were “2C”, and 11 were “2D”. There were 11 statements that were not graded. The grades should be taken seriously. The lack of recommendations that are graded “1A” suggests that there are few opportunities for developing clinical performance measures from this guideline. The preponderance of “2” recommendations suggests that patient preferences and other circumstances should be strongly considered for most recommendations. The lack of “A” and “B” grades of overall quality of evidence is a result of the lack of patient-centered outcomes as end-points in the majority of trials in this field, and thus suggests strongly that additional research is needed in CKD-MBD. Indeed, the extensive review that led to this guideline often exposed significant gaps in our knowledge. The Work Group made a number of specific recommendations for future research needs. This will hopefully be of interest to future investigators and funding agencies. Grading Options: 1A, 1B, 1C, 1D, 2A, 2B, 2D, 2D, & “not graded” 56
 system. The system that was adopted allows provision of guidance even if the evidence base is weak, but makes the quality of the available evidence transparent and explicit. It is described in detail in the present CKD-MBD guideline (Chapter 2). Each recommendation is rated 1 or 2, with 1 being a We recommend … statement implying that most patients should receive the course of action, and 2 being a We suggest … statement implying that different choices will be appropriate for different patients. In addition, each statement is assigned an overall grade for the quality of evidence, A (high), B (moderate), C (low), or D (very low). The grade of each recommendation depends on the strength of the evidence, but also on additional considerations. A key issue is whether to include guideline statements on topics which can not be subjected to systematic evidence review. KDIGO has decided to meet this need by including some statements that are not graded. Typically, ungraded statements provide guidance that is based on common sense, e.g., reminders of the obvious, and/or recommendations that are not sufficiently specific enough to allow application of evidence. Examples include the frequency of laboratory testing and the provision of routine medical care. The CKD-MBD guideline encompasses many aspects of care for which there is little or no evidence to inform recommendations. Indeed, there are only three recommendations in the CKD-MBD guideline for which the overall quality of evidence was graded A , while 12 were graded B , 23 were graded C , and 11 were graded D . Although there are reasons other than quality of evidence to make a grade 1 or 2 recommendation, in general, there is a correlation between the quality of overall evidence and the strength of the recommendation. Thus, there are 10 recommendations graded 1 and 39 graded 2 . There were two recommendations graded 1A , five were 1B , three were 1C , and none were 1D . There was one graded 2A , seven were 2B , 20 were 2C , and 11 were 2D . There were 11 statements that were not graded. The grades should be taken seriously. The lack of recommendations that are graded 1A suggests that there are few opportunities for developing clinical performance measures from this guideline. The preponderance of 2 recommendations suggests that patient preferences and other circumstances should be strongly considered for most recommendations. The lack of A and B grades of overall quality of evidence is a result of the lack of patient-centered outcomes as end-points in the majority of trials in this field, and thus suggests strongly that additional research is needed in CKD-MBD. Indeed, the extensive review that led to this guideline often exposed significant gaps in our knowledge. The Work Group made a number of specific recommendations for future research needs. This will hopefully be of interest to future investigators and funding agencies. Grading Options: 1A, 1B, 1C, 1D, 2A, 2B, 2D, 2D, & not graded 56.")
57
KDOQI Mineral and PTH targets
Stage 3 Stage 4 Stage 5 Calcium Normal range mmol/l Phosphate Ca x P <3.6 mmol/l <3.6 mmo/l/ < 4.3 mmol/l PTH pmol/l National Kidney Foundation. Am J Kidney Dis 2003;42:S1-S202 57

58
Diagnosis of CKD-MBD: Vascular Calcification
In patients with CKD Stages 3-5D, we suggest a lateral abdominal radiograph can be used to detect the presence or absence of vascular calcification, and an echocardiogram can be used to detect the presence or absence of valvular calcification, as reasonable alternatives to computed tomography (CT)-based imaging (2C). We suggest that patients with CKD Stages 3-5D with known vascular/valvular calcification be considered at highest cardiovascular risk (2A). It is reasonable to use this information to guide management of CKD-MBD (not graded).
-based imaging (2C) We suggest that patients with CKD Stages 3-5D with known vascular/valvular calcification be considered at highest cardiovascular risk (2A). It is reasonable to use this information to guide management of CKD-MBD (not graded).")
59
Summary Patients with CKD are at high CVS risk and CKD-MBD is a major contributor Observational data show the importance of several factors (low vitamin D, ↑ Phosphate, ? ↑ Calcium dose, ↑ PTH) Early phosphate rise seems to be important in earlier CKD and even in the general population (relevance of FGF-23?) Interventional studies suggest that calcification can be slowed Further interventional studies (eg EVOLVE) are necessary to guide optimal treatment in CKD-MBD
 Early phosphate rise seems to be important in earlier CKD and even in the general population (relevance of FGF-23 ) Interventional studies suggest that calcification can be slowed. Further interventional studies (eg EVOLVE) are necessary to guide optimal treatment in CKD-MBD.")
Similar presentations


 Trial Presented at The American College of.>")


>")