Download presentation
Presentation is loading. Please wait.

1
NIRS: Functional Neuroimaging in the regulation of eating behavior
Neuroscience Models of Obesity Jean-Claude Vouakouanitou ECNR 16133 Ventura Blvd, 7th Floor Encino, CA 91436 (818)
")
2
Acknowledgements Hershel Toomim, Biocomp Research Institute, Los Angeles Athinoula A. Martinos Center for Biomedical Imaging Massachusetts General Hospital, Harvard Medical School E. Mark Haacke, Wayne State University Vladislav Toronov, University of Illinois E.Roy John, NYU School of Medecine Joel Lubar, University of Tennessee Song Lai, University of Connecticut Hanli Liu, Group3 - BME 5345

3
BFKT ™ Ponderal Neurobiological Regulation

4
BFKT Weightloss! 100% All Natural Enhance Fat Oxidation
Lose fat permanently

5
Introduction Most studies in psychophysiology research have used physical variables. For example: heat and temperature, movement and speed, pressure and force, etc. Among forces, that of gravity has been somewhat neglected.

6
This work was done to promote an interest in the principles of electrophysiology using the framework of behavioral therapy. In thinking about individual personal weight the saying goes: “You are what you eat!” which we understand as "you weigh what you eat" Your weight is determined by the quantity of the food you eat.

7
We realized that in order to make this method known to the public and to emphasize its real significance, one should propose a simple example, usable by anyone and everyone. People who use it are able to operate alone with a minimum of instrumental support, whether or not they are under the observation of a monitor or a therapist.

8
In the following discourse we will use "weight" and its measure as a unique physical variable.
Then comparing with a model to be emulated, there are repeating trials that reduce the gap between variables and the model. Finally, one learns the progressive correction of errors to be obtained in an instant gratification for each successful performance. All these things contribute to the basis of the electrophysiology method.

9
Obesity is an international scourge…
We wanted: - to assess side effects such as weight gain of patients treated with antipsychotic medications to explore the use of body weight or that of the daily food ration as a physical dimension inserted in a feedback loop. This is another way to combat weight gain which is a pressing social issue, especially in the United States where 127 million adults are overweight, 60 million obese, and 9 million severely obese.

10
…a public health problem, a plague, a world epidemic.
64.5% in the USA 8% in France 2% in China Developing countries are also affected by obesity.

11
To weigh the pounds which we must weigh eliminates a certain number of immediate or future dangers:
the fatigue of the heart and/or the cardiovascular system, the fatigue of the heart and/or the cardiovascular system, the overload of the vessels in lipids or usable deposits, the accumulation of body fat, a shortened life expectancy… Jim Pozarik / Getty Images file

12
We present a new approach, “Ponderal Neurobiological Regulation”, to explore the use of body weight in relation to the daily food ration.

13
A big person is a person who eats too much
Others say: “Let’s eat less sugar; let’s eat less fat; or don’t eat meat; so don’t absorb so many calories…” I say: Weight is much easier to measure than calories. If a person begins eating too much of the wrong food and stops exercising, he or she will develop habits that are difficult to change. Before long, obesity will take over. To be slim, it is necessary to be less big To be less big, it is necessary to weigh less To weigh less, it is necessary to eat less.

14
Person Balance Food Balance Person
Biopensum (from latin “pendere” = weight) is a method of assistance to the weight decrease and its control. This method is not a regimen. It is only a question of being or of becoming very conscious of the weight of what one eats, and to connect this weight to the pounds that one weighs. Person Balance Food Balance Person
 is a method of assistance to the weight decrease and its control. This method is not a regimen. It is only a question of being or of becoming very conscious of the weight of what one eats, and to connect this weight to the pounds that one weighs. Person Balance Food Balance Person.")
15
Our ponderal neurobiological regulation method of weight control is simple. It involves balancing the amount of food you eat with the amount you weigh. Person Balance Food Balance Person It involves becoming conscious of the amount you eat and the amount your body will absorb.

16
if (Wa) = average current Weight,
(Ra) = Ration average current day, (Wi) = ideal Weight (weight corresponding to largest life expectancy) (Ri) = ideal Ration (ration corresponding at the maximum great life expectancy) (Ra)/(Wa) = ka, expresses the current proportionality
 = Ration average current day, (Wi) = ideal Weight (weight corresponding to largest life expectancy) (Ri) = ideal Ration (ration corresponding at the maximum great life expectancy) (Ra)/(Wa) = ka, expresses the current proportionality.")
17
or (Wa) = (Ra)/ka, ka being a constant, personal and current. It has been able to be different in the past, when you were two younger time. Thus for the same reasons, there is a balance, i.e. a relationship quite as fixed between your ideal weight, or reference weight, and that of your ideal ration: (Ri)/(wi) = ki
/(wi) = ki.")
18
or (wi) = (Ri)/ki, ki being also a personal constant. This second ratio is practically the same one with little of thing close that the precedent but however not completely. In any event one can to write

19
and (Ra)/(Wa) = K. (Ri)/(Wi)
K = ka/ki (close to 1) and (Ra)/(Wa) = K. (Ri)/(Wi) This relation has the merit to provide a first approximation of the weight of the ration which should be henceforth your daily ration ideal, at least with to leave the moment when you will have carried out your adjustment ponderal, i.e. still when you lose sufficient to weigh your ideal weight. Here this ration: (Ri) = (wi). (Ra)/(Wa). K.
 and (Ra)/(Wa) = K. (Ri)/(Wi) This relation has the merit to provide a first approximation of the weight of the ration which should be henceforth your daily ration ideal, at least with to leave the moment when you will have carried out your adjustment ponderal, i.e. still when you lose sufficient to weigh your ideal weight. Here this ration: (Ri) = (wi). (Ra)/(Wa). K.")
20
Who can benefit from Ponderal Neurobiological Regulation ?
If your excess weight does not exceed 36% of your ideal weight, Ponderal Neurobiological Regulation program can help you successfully lose excess weight and keep it off for good! For example, if your ideal weight is 120 – 150 lbs, and your weight 160 – 200 then we can help you achieve your weight goal.

21
No regimen, but strong motivation is needed
No regimen, but strong motivation is needed. A simple formula can help you: you weigh 55 times (45 to 55 times, average is 50) what you absorb In other words, if you weigh 121 pounds, you absorb 2.42 pounds of food a day (121 lbs divided by 50).
 what you absorb. In other words, if you weigh 121 pounds, you absorb 2.42 pounds of food a day (121 lbs divided by 50).")
22
If you want to weigh 100 lbs instead your “ideal” body weight would require that you absorb 2 lbs of food a day. (100 divided by 50). To gradually lose the 21 lbs over time, you would need to reduce your intake by .40 lbs per day (2.42 lbs less 2 lbs). Average: In one week, you will lose 2.2 lbs. It corresponds with a daily reduction of between oz.
. Average: In one week, you will lose 2.2 lbs. It corresponds with a daily reduction of between oz.")
23
Current ingestas in ascending thick lines :
B (breakfast), L (lunch) and D (dinner) Excreta in downward violet lines : M (micturitions), Ms (motions), etc. But in the course of 24 hours, the significance of each weighing of body weight could seem difficult to understand because weight is constantly changing.
, L (lunch) and. D (dinner) Excreta in downward violet lines : M (micturitions), Ms (motions), etc. But in the course of 24 hours, the significance of each weighing of body weight could seem difficult to understand because weight is constantly changing.")
24
Materials and Methods We use two electroneuropsychobiological approaches : Quantitative electroencephalography (qEEG) Functional Near IR Spectroscopy (fNIRS)
")
25
To implement relationships between Synaptic Activity and Hemodynamic Responses, we used an integrated system combining Near Infrared Spectroscopy (NIRS) and electroencephalographic activity (EEG).
 and electroencephalographic activity (EEG).")
26
How to merge these two technologies
How to merge these two technologies ? conventional radio-frequency RF wireless and optical fibers. We have mathematical solutions Poisson Equation & diffusion equation

27
The spectral range is 660 – 1100 nm.
With different-measurement approaches we can cover most of the adult head, especially to collect optical data from prefrontal, sensorimotor and visual cortices in both hemispheres simultaneously.

28
We also can provide 3D images which offer high spatial and temporal resolution of the brain and images of hemodynamic parameters, such as: cerebral changes in oxygenated (ΔO2Hb) deoxygenated hemoglobin (ΔHHb) total hemoglobin (ΔcHb = ΔO2Hb + ΔHHb) the mitochondrial enzyme cytochrome oxidase (or cytochrome aa3) (ΔCtOx) in µmol, calculated with Lambert-Beer's Principle.
 deoxygenated hemoglobin (ΔHHb) total hemoglobin (ΔcHb = ΔO2Hb + ΔHHb) the mitochondrial enzyme cytochrome oxidase (or cytochrome aa3) (ΔCtOx) in µmol, calculated with Lambert-Beer s Principle.")
29
We carried out simultaneous EEG-NIRS recordings
We developed a reflectance continuous-wave near-infrared spectroscopy topography system with multi-source (48 laser diodes) and six or eight objective lenses. Some wavelengths were emitting red and others near infrared.
 and six or eight objective lenses. Some wavelengths were emitting red and others near infrared.")
30
An integrated whole-head optical system combining Near Infrared Spectroscopy (NIRS) and electroencephalographic activity (EEG) shows: A correlation between cognitive paradigms and hemodynamic signals. A collection of optical data from prefrontal, sensorimotor, and visual cortices in both hemispheres simultaneously.

31
48 light sources and six lenses video camera can also be placed in the NB Optical Head to provide tomographic imaging of the brain. This combines two technologies: conventional radio-frequency RF wireless and optical fibers.

32
Light sources: 660/820 (2) 660/980 (2) 664/848 (2) 664/830 (1) 758/830 (8) 760/840 (3) 779/834 (1) 780/870 (2) 780/960 (2) 782/830 (1) Optical fibers snake over the scalp so that we can cover most of the adult head. 6 or 8 objective lenses of infrared video camera. To have good quality of changes in concentration 24 pairs of laser diodes with intensity modulated at 110 MHz were combined between 660 and 980 nm.

33
For acquiring high quality EEG and NIRS…
Our whole-head optical system combines Near Infrared Spectroscopy and electroencephalographic activity so, the optical and electrical signals were recorded simultaneously.

34
Top, Front and Side of the Neurobek box.
The sensor image inside the camera uses advanced real-time signal processing.

35
To test the models, a psychophysiological experiment was carried out with five groups:
Healthy volunteers (BMI < 24 kg/m2, 3M/5F, age 46 ± 9 y, body fat 21 ± 6%), Type 2 diabetes mellitus and PAD (n 5, 2M/3F) Obese only (BMI>35 kg/m2, 5M/7F, age 45 ± 6 y, body fat: 42 ± 5%). Bipolar disorder (n 6, 2M/4F) Schizophrenia (n 5, 3M/2F)
, Type 2 diabetes mellitus and PAD (n 5, 2M/3F) Obese only (BMI>35 kg/m2, 5M/7F, age 45 ± 6 y, body fat: 42 ± 5%). Bipolar disorder (n 6, 2M/4F) Schizophrenia (n 5, 3M/2F)")
36
Group BMI N Age Body Fat Healthy volunteers kg/m2 3M/5F 46±9 y ±6% Type II diabetes 35 kg/m2 2M/3F 65±7 y ±7% Obese 35 kg/m2 5M/7F 55±6 y ±5% Bipolar disorder 30 kg/m2 2M/4F 63±8 y ±9% Schizophrenia 30 kg/m2 3M/2F ±5 y ±8%

37
MicroCog Glycosylated hemoglobin (HbA1C) Liver and renal functions Body fat measurements The measuring tape were assessed and compared at the baseline, at a 3 month and at a 6 month period. Subjects in this study consumed an herbal tea containing pBFKT 750 (kolokoto tea, 0.39 US gal) daily for six months. FDA Import Permit BFKT™ imported from Congo under CITES & USDA.
 daily for six months. FDA Import Permit. BFKT™ imported from Congo under CITES & USDA.")
38
Prisca, 28 y. o Weight: 264 lbs, Height: 5’7” BMI = 40.91
The daily body weighing of Prisca and the immediate notation of the resulting weight. Became her motivational desire to obtain a progressive and finally sufficient weight loss. She achieved this, thanks to a daily adjustment and an adapted food rationing.

39
Beginning on November 1st 2006
End on May 30th 2007 Target Period Intake solution 1st target lbs Jan.30th Av.2 ,7 2nd target lbs Feb 28th Av 2.7 3rd target lbs March 30th Av 2.65 4th target lbs May 15th Av. 2.56 lost : between 119 and 75 lbs Average: 97 lbs 16 lbs per month.

40
Whatever long the reduction period has been, it has to be followed by a Stabilization period.
For many people, the end of a weight loss period or that of a diet of ponderal reduction means the end of a small torture. Many will return at last to previous habits. In a very short time they will be back to their initial weight, the one at which they were before ponderal reduction.

41
Prisca showing her weight lose
October 2006 5’7” 264 lbs January 2007 175 lbs April 2007 145 lbs

42
Results Results shown an increase (p < 0.005) in cerebral blood volume and COV in areas of the prefrontal, parietal and temporal cortex. This blood increase occurs during a calculation and verbal-fluency tasks while it decreases in the orbito-frontal of an obese individual compared to a healthy volunteer (P < 0.05).
.")
43
This study provides preliminary evidence that patients suffering from type II diabetes and obesity had higher fasting plasma glucose (85.2 ± 5.4 vs ± 8.5 mg/dl; P = ) and insulin concentrations (6.9 ± 4.1 vs. 2.8 ± 1.9 microU/ml; P < ).
.")
44
Other changes values from 8. 2 to 4
Other changes values from 8.2 to 4.7 for HbA1C whereas for BMI from 35 and more to 24 and 22.5 were observed. Some tasks of Horatherapy such as the “1” and cognitive enhancing exercises increase both CBV and COV in the affected prefrontal cortex of patients with obesity.

46
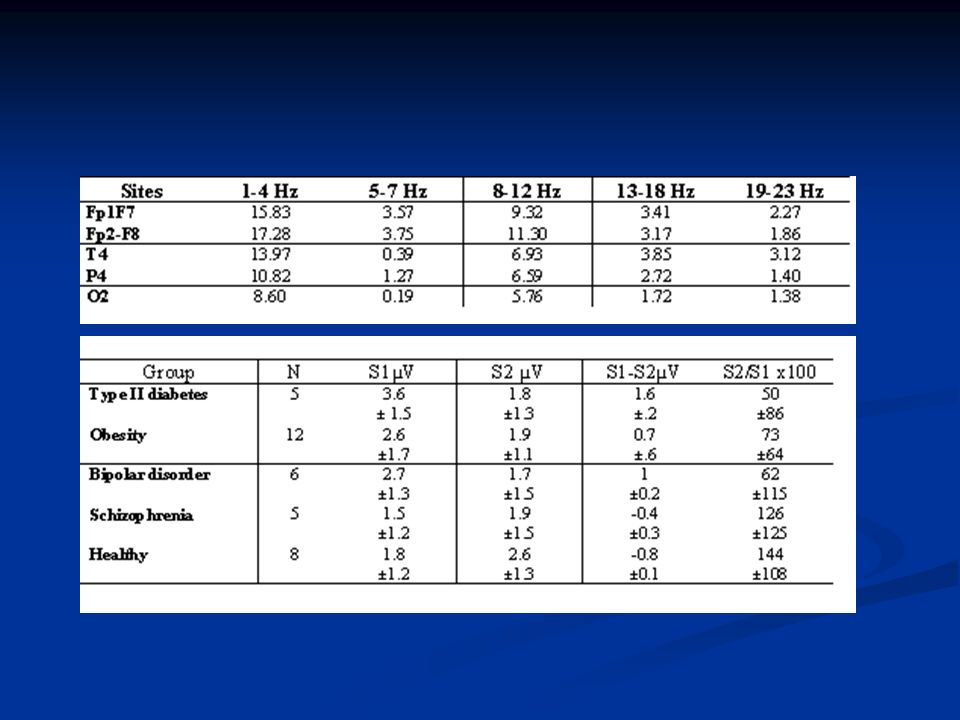
Quantitative analysis of [O2Hb] & [HHb]
Subjects [O2Hb]0 (mM) [HHb] 0 D[O2Hb] D[HHb] DP% CP DR% CR AP/AR r2 with R without R Type II diabetes Mellitus 00.6 ±1.2 -1.19 ±0.27 0.007 -0.25 ±0.25 0.97 0.95 0.83 0.90 2.40 ±1.18 0.784 Obesity 30.1 ±2.7 6.0 ±1.8 0.52 0.23 3.49 0.96 0.920 2.64 ±0.35 0.976 0.9375 Bipolar disorder & Shizophrenia 0.009 ±4.3 6.3 ±1.5 0.41 0.25 3.57 0.94 0.57 0.45 2.37 ±1.64 0.989 0.8937 Healthy 31.5 ±3.2 12.7 ±1.4 0.39 0.37 3.39 0.82 -0.26 3.72 ±0.89 0.8685 0.8451
![Quantitative analysis of [O2Hb] & [HHb]](http://slideplayer.com/slide/259428/1/images/46/Quantitative+analysis+of+%5BO2Hb%5D+%26+%5BHHb%5D.jpg "Subjects. [O2Hb]0. (mM) [HHb] 0. D[O2Hb] D[HHb] DP% CP. DR% CR. AP/AR. r2. with R. without R. Type II diabetes Mellitus ± ± ± ± Obesity ± ± ± Bipolar disorder & Shizophrenia ± ± ± Healthy ± ± ±")
47
Statistics of physiological parameters
Total Right Middle Left Scalp Brain brain StOx (%) 61.25 ± 3.57 62.38 ± 5.82 61.69 ± 3.04 64.73 ± 5.78 60.78 ± 3.14 64.38 ± 5.93 61.07 ± 3.85 65.68 ± 5.83 tHb (M) 47.12±10.7 73.85 ± 12.8 56.67 ± 8.13 78.96 ± 12.14 53.67 75.65 ± 14.29 66.73 ± 12.64 75.93 ± 14.96 O2Hb 37.38 ± 7.81 54.71 ± 11.5 43.61 ± 5.75 58.34 ± 9.05 38.42 ± 8.23 56.29 ± 12.60 38.93 ± 9.14 56.57 ± 12.63 HHb 15.59 ± 3.25 19.56 ± 5.84 15.83 19.87 ± 5.62 14.69 ± 3.53 19.67 ± 5.89 15.79 ± 3.46 19.71 ± 6.95 DPF =758nm 6.09 ± 0.71 4.89 ± 1.35 6.17 ± 0.85 4.76 ± 1.26 6.15 ± 0.67 4.66 ± 1.92 5.98 ± 0.91 4.75 ± 1.35
 ± ± ± ± ± ± ± ± tHb. (M) 47.12± ± ± ± ± ± ± O2Hb ± ± ± ± ± ± ± ± HHb ± ± ± ± ± ± ± DPF. =758nm ± ± ± ± ± ± ± ±")
48
conclusions Obesity is mostly caused by overeating.
Ponderal neurobiological regulation (pBFKT) can be used as an effective way to combat weight gain with motivation. Bridelia ferruginea have been validated for treating type II diabetes, overweight and obesity. Near Infrared Opitical Imaging can be used to pinpoint the regulation of eating behavior.
 can be used as an effective way to combat weight gain with motivation. Bridelia ferruginea have been validated for treating type II diabetes, overweight and obesity. Near Infrared Opitical Imaging can be used to pinpoint the regulation of eating behavior.")
49
Thank you very much ! ACKOWLEDGEMENT
This research is supported by Electrophysiology & Clinical Neuroscience Research (ECNR). © Los Angeles, Encino, 2006, 2007
. © Los Angeles, Encino, 2006,")
Similar presentations


 patients Policy.>")

 Grants Chapter 6.>")